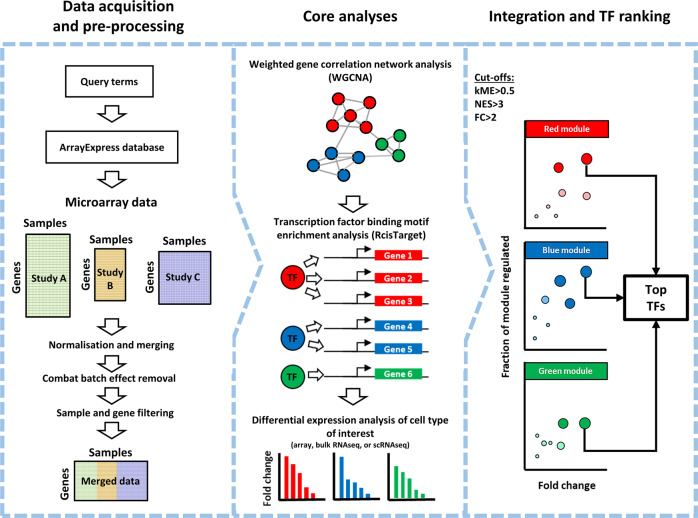
Fig. 2. CenTFinder computational workflow.
Schematic overview of the CenTFinder workflow for identification of TFs (central in differentiation and specification). Left panel: data acquisition and pre-processing. The analysis starts by defining queries that are used for filtering and retrieving relevant expression data from the ArrayExpress database. Retrieved microarray data (of different formats) are combined and normalised and batch corrections are applied. Alternatively, a pre-processed expression matrix can be provided as input. Middle panel: core analyses. The expression matrix is subsequently subjected to gene co-expression analysis (WGCNA), TF binding motif enrichment analysis (RcisTarget), and the results are overlapped with differential expression analysis. Right panel: integration and TF ranking. The last step in the workflow is to combine the output of WGCNA, RcisTarget, and differential expression analyses to prioritise and rank TFs. Additional downstream analyses, e.g., Gene Ontology enrichment, and Cytoscape network visualisations are performed at this step.

