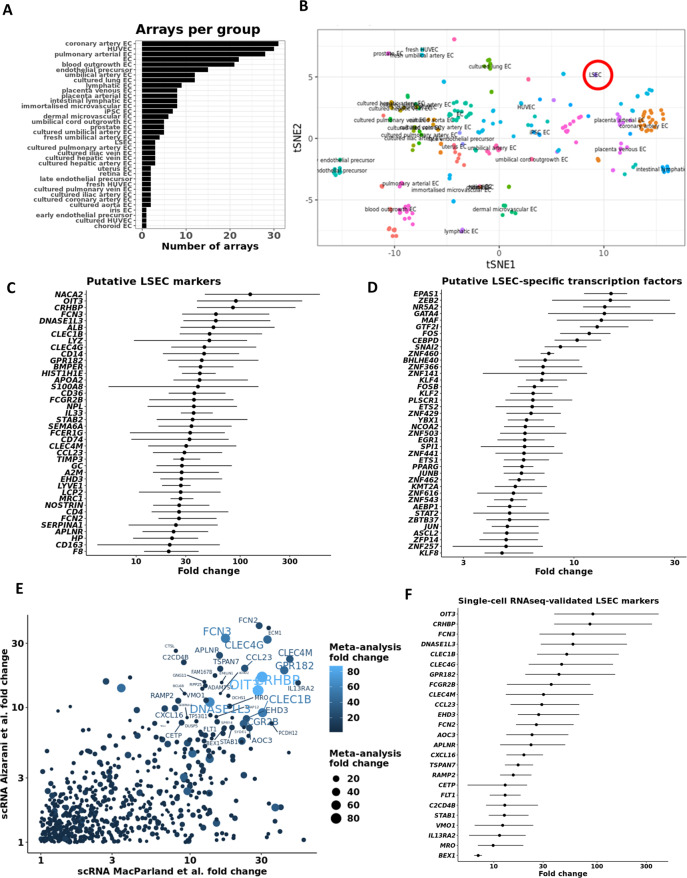
Fig. 3. Intersection between microarray meta-analysis and single-cell RNAseq identifies putative LSEC markers.
A Bar chart indicating the number of microarrays per endothelial cell type that was included in the CenTFinder analysis (total number of arrays = 279). B t-SNE representation of all endothelial cells used in the analysis (LSECs circled in red). LSEC microarray data were contrasted to the expression data of all other endothelial cells used in the meta-analysis. Line charts show putative markers (C) and TFs (D) with increased expression in LSECs compared to all other endothelial cells (assessed by Wilcoxon rank-sum test). Putative markers and TFs were sorted by fold change. Dots indicate the mean fold change between LSECs and all other ECs. Lines span the interquartile range. E Overlap of genes that are specifically expressed in LSECs in the single-cell RNA-sequencing studies and in the microarray meta-analysis. The identified genes are more expressed in LSECs compared to all other endothelial cells, as well as compared to all other parenchymal and non-parenchymal liver cells. X- and Y-axes denote the two single-cell RNAseq studies42,45. F LSEC marker ranking by fold change compared to all other ECs in the microarray meta-analysis. For this analysis, genes were ranked only if in each of the studies they were more than sevenfold higher expressed in LSECs compared to the other cells. Dots indicate the mean fold change between LSECs and all other ECs. Lines span the interquartile range.

