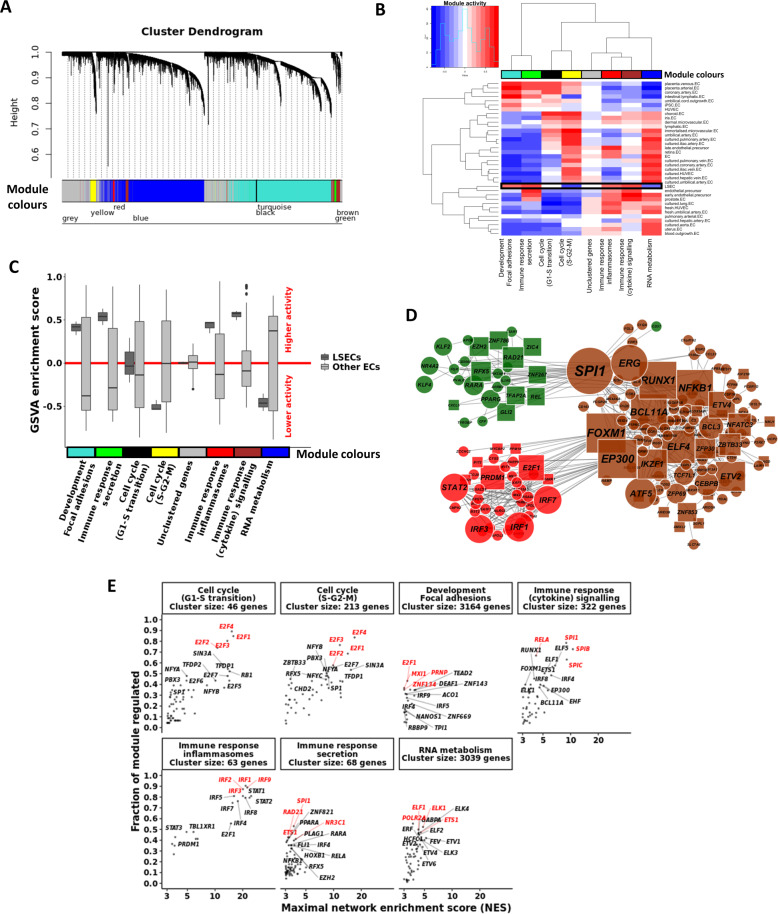
Fig. 4. Gene co-expression (WGCNA) and transcription factor binding motif (RcisTarget) analyses.
A WGCNA cluster dendrogram visualising the gene co-expression modules identified in the microarray meta-analysis. These modules are active in at least one of the endothelial cell types. The grey module contains genes unassigned to any module due to low correlative values. B Heatmap and clustering of the gene set variation analysis (GSVA) activity scores for each of the modules and for each of the cell types. Module colours correspond with those from the cluster dendrogram in A. Black box identifies module activities in LSECs. C Boxplots of the GSVA enrichment scores for each of the modules, comparing LSECs to all other endothelial cell types. D Cytoscape visualisation of the LSEC-specific immune response modules. Edges indicate a regulatory link identified by RcisTarget. TF node size relates to the number of downstream targets. For the sake of simplicity, only nodes of the 20 most differentially expressed downstream targets are shown for each TF. Nodes were coloured according to their module colour. TFs belonging to other modules but with a kME > 0.5 for either the brown, red, or green modules were included as well and coloured accordingly. Circular (square) nodes represent genes that are higher (lower) expressed in LSECs compared to ETV2-ECs. E Enrichment of TF binding motifs was calculated for each of the WGCNA gene co-expression modules. Each dot represents an enriched TF binding motif with the x-axis indicating the RcisTarget network enrichment score (NES) and the y-axis indicating the fraction of genes in the respective module that has binding motifs for the respective gene. For genes with multiple enriched motifs, only the motif with the highest NES is shown. Top TFs are highlighted in red.

