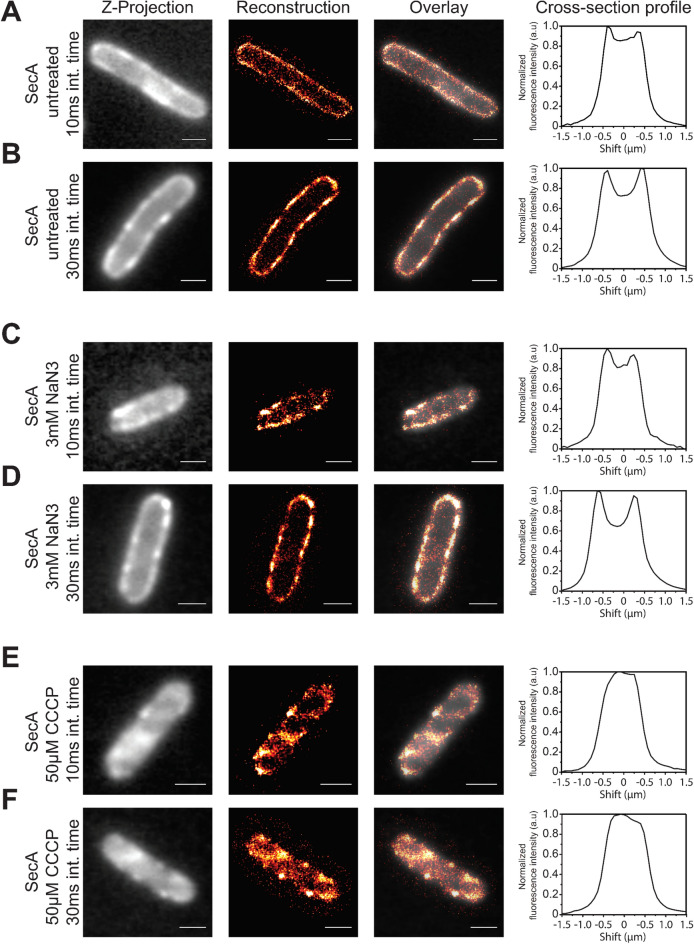
Figure 1.
Super-resolution reconstructions and cellular distributions of SecA-Ypet under different conditions. (A,B) SecA under native conditions, (C,D) SecA-mediated translocation is blocked by 3 mM NaN3 (E,F) protein translocation is impaired due to collapse of the PMF by 50 µM CCCP. (A–F). Visible in the left panels (Z-projection) are the results of averaging the fluorescence in the first 7.5 s into one image with a single frame acquisition time of 10 ms (A,C,E) and 30.5 ms (B,D,F). Signals observed in the cytosol are a combination of fast moving cytosolic (auto)fluorescence and out of focus signals originating from molecules within the cytoplasmic membrane on the axial axis. Second panel (Reconstruction), super-resolution reconstruction images showing signal detected at the cytoplasmic membrane. Colors indicate the frequency and accuracy of signal observed at the coordinate. Red indicating a low fit accuracy and/or frequency, whereas white signifies a high fit accuracy and/or frequency of fluorescence observed at that location. Third panel (Overlay), a merge of the super-resolution reconstruction with Z-projection to clarify the localization of SecA-Ypet. Fourth panel (Cross-section profile), a short axis cross section profile of the normalized fluorescence intensity distribution of each cell. Scale bar is 1 µm.

