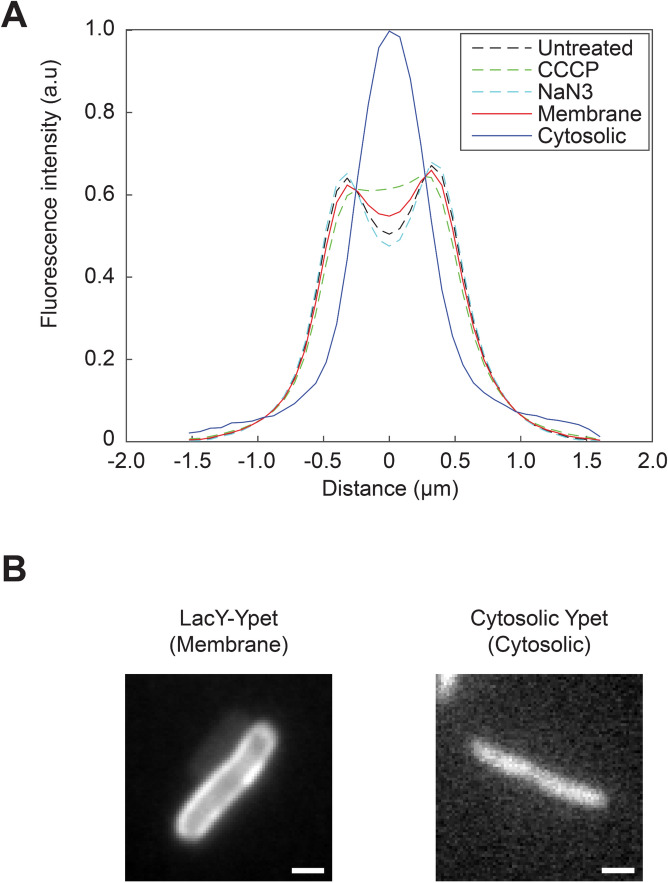
Figure 2.
Cellular distribution profiles. (A) Cellular distribution profiles of the fluorescence for the membrane protein LacY-Ypet (Membrane, red solid line), cytosolic protein Ypet (Cytosolic, blue solid line) and SecA under native conditions (Black dashed line), treatment with 3 mM NaN3 (Green dashed line) and treatment with 50 µM CCCP (Cyan dashed lines). (B) Z-projections of the membrane marker LacY-Ypet and cytosolic marker cytosolic Ypet. Plots are the result of averaging the fluorescence in the first 10 s into one image with a single frame acquisition time of 30 ms. Scale bar is 1 µm.

