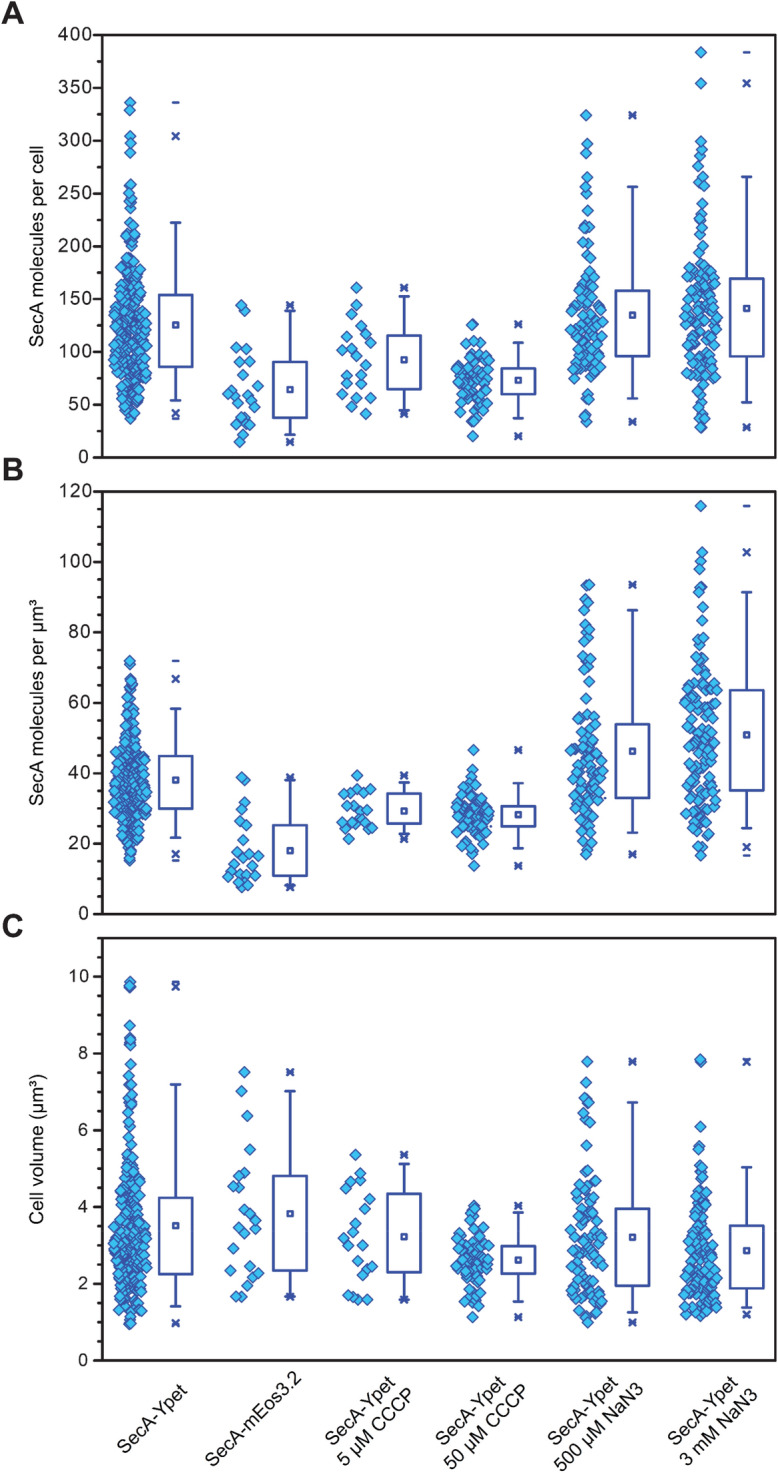
Figure 3.

Cellular SecA copy numbers under different conditions. Plotted per condition are the values for each individual cell (left, open diamond) and corresponding boxplot (right) showing the lower 25% and upper 75% quartile with mean indicated by (open square). (A) SecA molecules calculated per cell. (B) SecA molecules per cubic micrometer or femtoliter, and estimated cell volumes (C). Whiskers indicate the lower 5% and upper 95% fence.
