Figure 6.
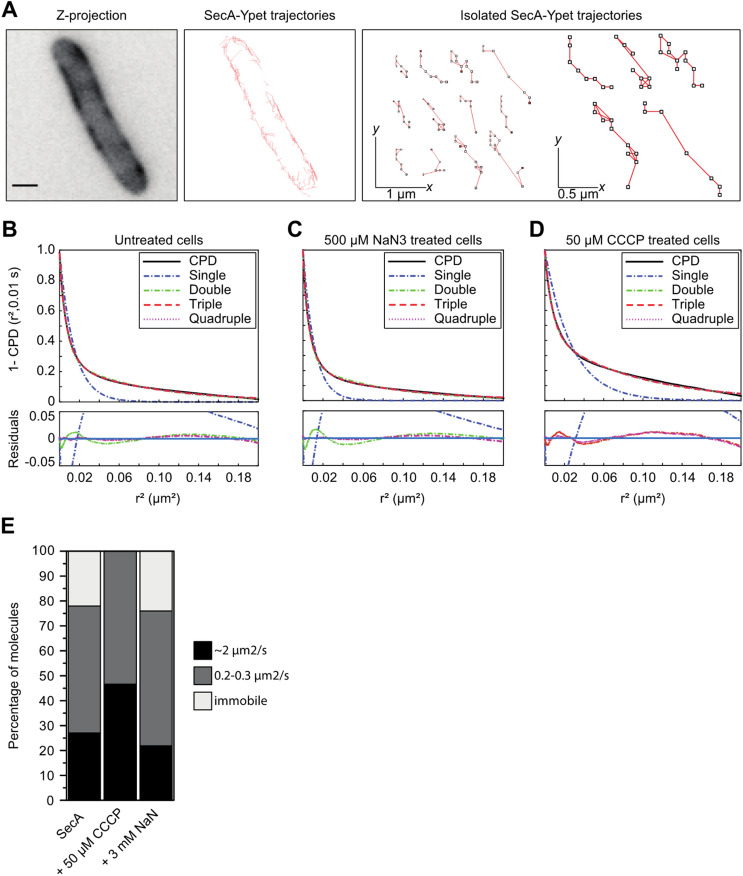
In vivo SecA-Ypet trajectories and diffusion curves. Scale bar is 1 µm. (A) Trajectories resulting from in vivo particle tracking display diffusion alongside the cytoplasmic membrane as well as static localization. (B–D, CDF, solid black line) reveal multiple populations (B–D, single, double and triple exponential CPD models, dashed lines) of different diffusion rates explaining the observed trajectories. CDF of untreated cells (B) and incubated with 3 mM NaN3 (C) are best described by a triple exponential CPD model. Indicating three diffusive populations. (D) CDF of cells incubated with 50 µM CCCP fits best to a double exponential CPD model, indicating two diffusive populations. (E) In vivo SecA-Ypet diffusion rates under native and protein secretion impaired conditions. Stacked bar chart summarizing the diffusion rates obtained from the CPD analysis. Under native conditions and impaired SecA-mediated protein secretion (+ 3 mM NaN3), three populations with comparable diffusion rates are observed. A significant change in the diffusive behavior of SecA is observed with the addition of 50 µM CCCP (+ 50 µM CCCP) as the immobile population is not detectable anymore. CPD indicates two populations remain.

