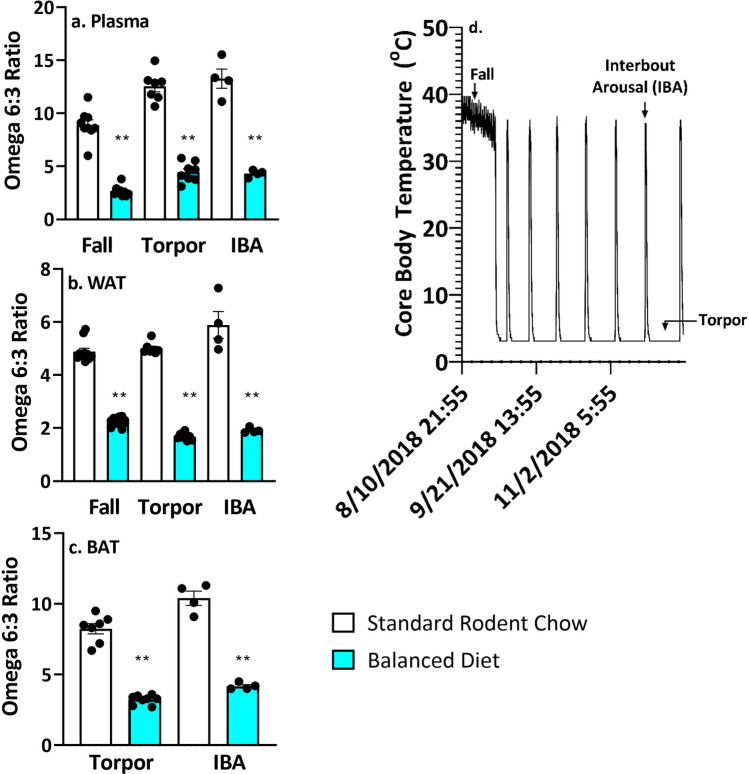
Figure 1.
Omega 6:3 ratio is lower in plasma, WAT and BAT of Balanced Diet AGS. (a) Plasma, **p < 0.001, two tailed t-test, fall n = 9, torpor n = 7–8, IBA n = 4. (b) WAT, **p < 0.001, two-tailed t-test, fall n = 11–12, torpor n = 7–8, IBA n = 4. (c) BAT, **p < 0.001, two tailed t-test, torpor n = 7–8, IBA n = 4. (d) An example of time points when AGS were sampled over the hibernation season. Data shown are mean ± SEM. Black dots are individual data points.

