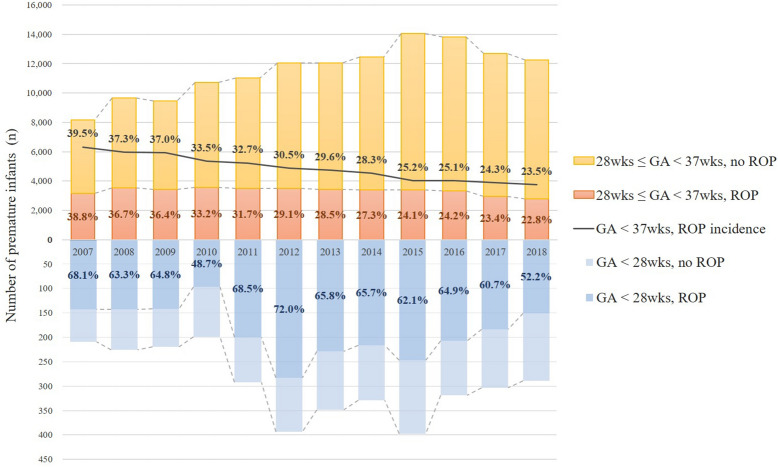
Figure 2.
Twelve-year trend of incidence of retinopathy of prematurity (ROP) among premature infants according to gestational age (GA) groups. The stacked bar graph above the horizontal axis indicates the annual number of premature infants of 28 weeks ≤ GA < 37 weeks, with and without ROP, and incidence of ROP (%). The stacked bar graph below the horizontal axis indicates the annual number of premature infants of GA < 28 weeks, with and without ROP, and incidence of ROP (%). The line graph indicates the annual incidence of ROP among premature infants with a GA < 37 weeks. GA gestational age, ROP retinopathy of prematurity.

