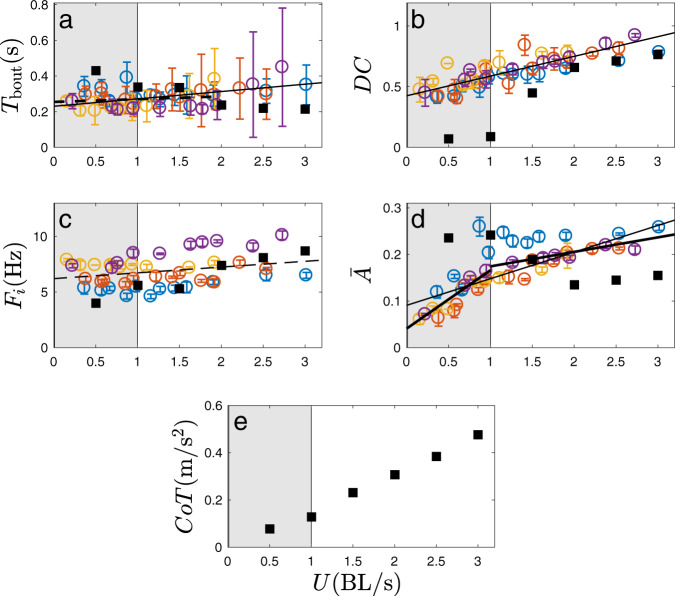
Fig. 2. Burst-and-coast properties and cost of transport as a function of the imposed swimming speed U in body length per second (BL/s).
a Bout duration Tbout. b Duty cycle DC = Tburst/Tbout. c, d Frequency and peak-to-peak amplitude of the tail beat during a bursting phase, respectively. e Cost and transport, CoT. Different marker colors correspond to different individuals. Error bars are standard deviations. The optimization results obtained from the burst-and-coast model based on 3D numerical simulations of an artificial swimmer are superimposed to the experimental data in filled black square symbols (■). Thick solid and dashed straight lines correspond to the linear mixed-effects model fits having, respectively, statistically significant and insignificant slopes. Panels (a) and (d) show global fits (thinner lines) and local piece-wise fits (thicker lines). See Supplementary Information (Part 1) for the source experimental data points for each fish.

