Figure 1.
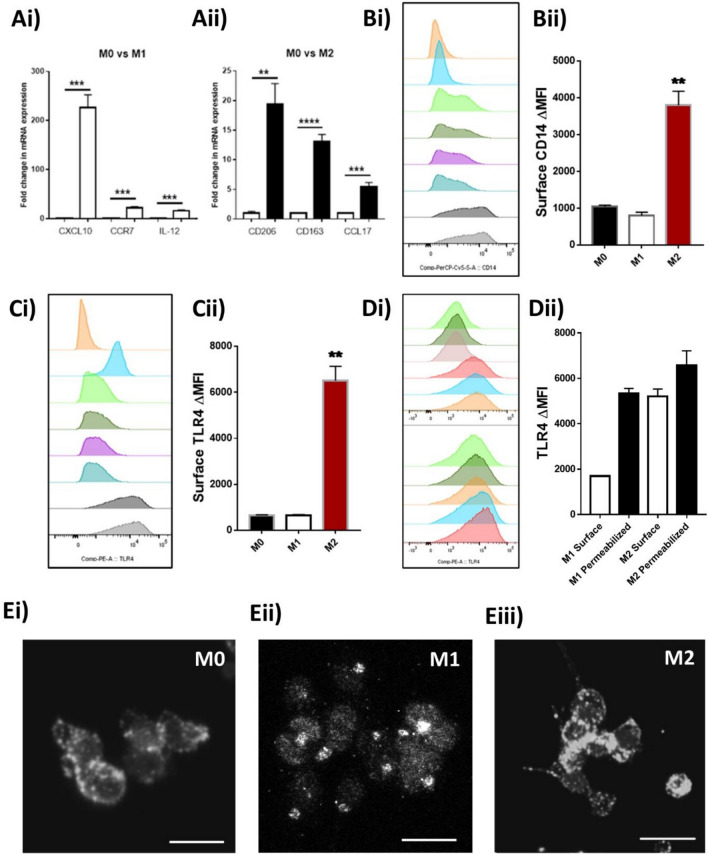
Differentiated M1 and M2 macrophage expression of TLR4 in vitro. PMA differentiated THP-1 monocytes (Resting M0-Macrophages) were stimulated for 24 h with either (50 ng/ml) recombinant human IFNγ (M1 polarization) or 25 ng/ml each of recombinant human IL-4 and IL-13 (M2). Polarity of matching sets of macrophages were initially confirmed by (A) qPCR analysis for (Ai) M1 markers: CXCL10, CCR7, IL-12 or (Aii) M2 markers: CD206, CD163, CCL17. Cell surface expression of (B) CD14 or (C) TLR4 was determined through flow cytometric analysis. Further analysis of total expression of TLR4 through permeabilization of cells and comparison to cell surface staining reveals (D) Abundance of TLR4 on the surface or total (including internal) of M1 and M2 polarized THP-1 macrophages. (E) Single colour immunofluorescent confocal microscopy images of TLR4 expression within (Ei) M0, (Eii) M1, (Eiii) M2 macrophages show differential patterns of staining within the cells. Images are a representative of 3 independent experiments. qPCR data is expressed as the mean ± SEM of 3 independent differentiations of THP-1 derived macrophages of passages 5–8. (Histograms: Pink-isotype control, Blue—THP-1 monocyte controls, Green and Dark Green—M0 macrophages, Purple and Blue—M1 macrophages, Dark and light grey—M2 macrophages). Scale bar = 20 µm. Statistical analysis performed on qPCR data was a two tailed multiple unpaired students t-test comparing stimulated to control, **P < 0.01, ***P < 0.001, ****P < 0.0001.

