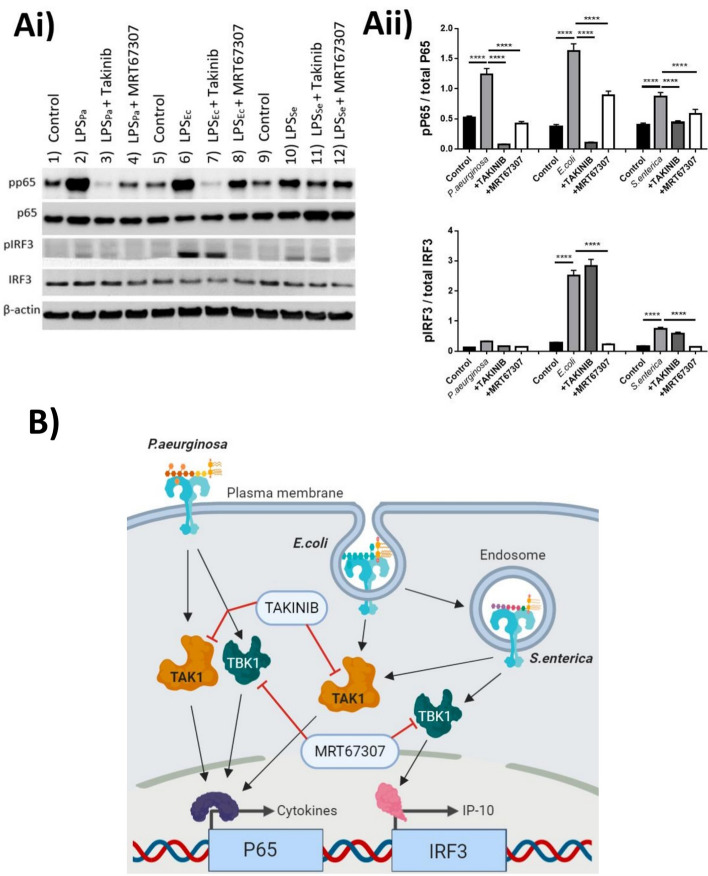
Figure 4.
LPS-driven phosphorylation of P65 and IRF3 is species specific and TAK1 and/or TBK1 dependent. Cells were then lysed and assayed for (Ai) phospho-P65, total p65, phospho-IRF3, total IRF3 and B-Actin acting as a loading control (Upper panel is a representative of n = 3 experiments). (Aii) Phosphorylated P65 and IRF3 were analysed in comparison to total P65 or IRF3 respectively. Data is represented as mean ± SEM of 3 separate stimulations performed on IFNγ differentiated M1 macrophages Passage 6–9. (B) Graphical representation of proposed signalling dynamics of the individual LPS via TLR4 and targets for TAKINIB or MRT67307 inhibitors. Cells were stimulated with LPS (1 ng/ml) with or without 1 h pre-treatment with TAKINIB (10 µM) or MRT67307 (10 µM) for 30 min in serum starved conditions. Membranes were stripped and re-probed, or cut longitudinally, to probe multiple antibodies within the same membrane, full-uncropped images can be found in Supplemental Fig. S1. The images in figure are from 2 separate gels and membranes. Statistical analysis performed on qPCR data was a one-way ANOVA with Tukeys posthoc test **P < 0.01, ***P < 0.001, ****P < 0.0001. Illustration created using Biorender.com. Figure generated by MS with permissions granted for publication.

