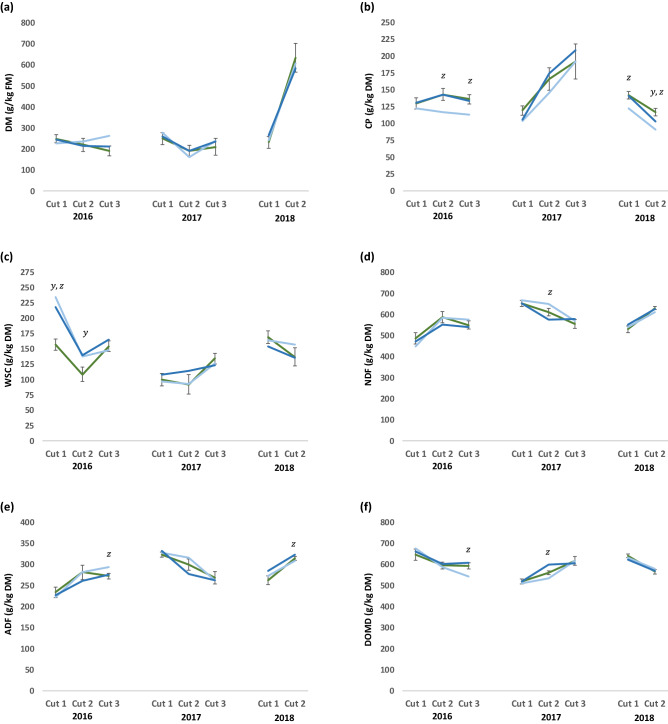
Figure 4.
Illustration of changes in sward nutritional parameters across seasons and years, (where green line = permanent pasture with fertiliser applied at a rate of 50 N kg/ha, 25 P kg/ha and 25 K kg/ha; dark blue line = permanent pasture under-sown with Narcissus pseudonarcissus, with fertiliser applied at a rate of 50 N kg/ha, 25 P kg/ha and 25 K kg/ha; light blue line = permanent pasture under sown with N. pseudonarcissus, with fertiliser applied at a rate of 25 N kg/ha, 12.5 P kg/ha and 12.5 K kg/ha; y = significant treatment effect of sowing N. pseudonarcissus (P < 0.05); z = significant treatment effect of rate of fertiliser application (P < 0.05); error bars = standard errors of the difference).

