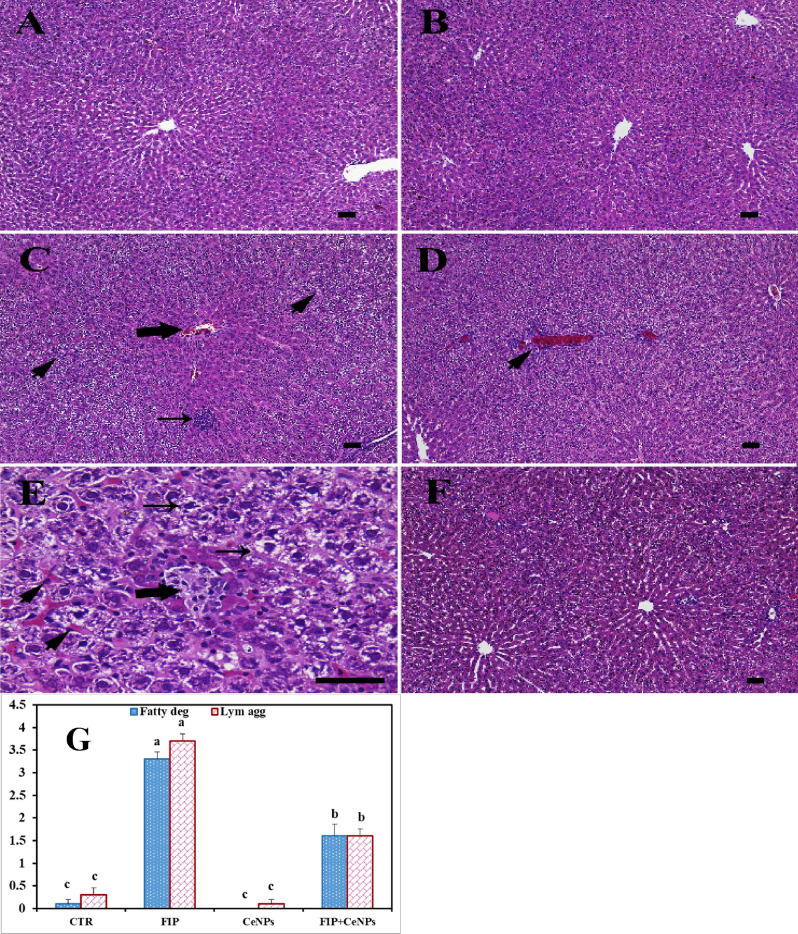
Figure 1.
Histopathological examination of rat liver. (A) Negative control group. (B) CeNPs group. (C–E) FIP group showing in (C) congested central vein (arrow), massive fatty degeneration in the periportal areas (arrowheads) and lymphocytic aggregation (arrow) in between massive fatty degeneration (arrowheads). (D) Highly congested portal vein surrounded with lymphocytic infiltration (arrowhead). (E) Necrotic foci (thick arrow), congested liver sinusoids (arrowheads) and fatty degeneration (thin arrows). (F) FIP group that treated with CeNPs. Scale bar = 50 µm. (G) H&E semi quantitative scoring of hepatic fatty degeneration and lymphocytic aggregations. Data expressed as Mean ± SE, analyzed using one-way ANOVA at P ≤ 0.05, column with different letters (a, b & c) indicate significant difference among the values of different groups.

