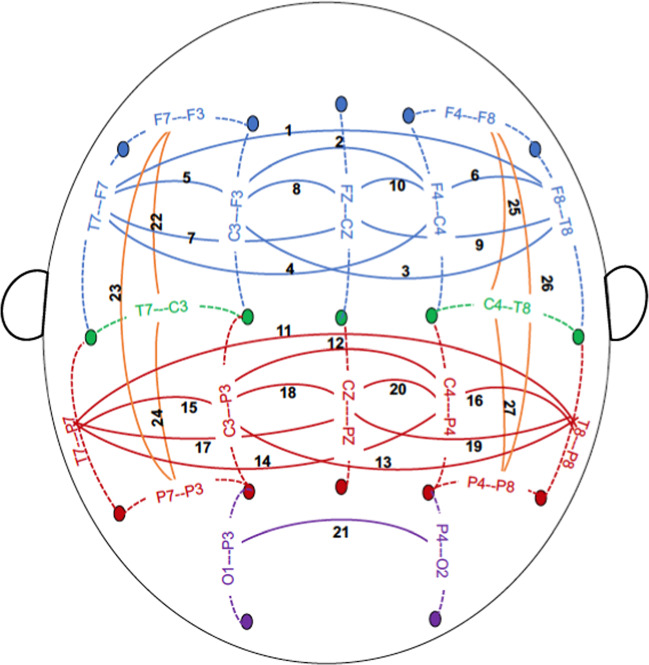
Fig. 1. Scalp topography of EEG electrodes used for the computation of coherence.
The schematic represents a top view of the scalp, nose up. Coherence (solid lines) was computed between bipolar EEG signals, each of which was derived from a pair of adjacent electrodes (connected by dotted lines). Electrode labeling: letters F, C, T, P, and O represent frontal, central, temporal, parietal, and occipital areas of the scalp, respectively; odd and even numbers represent the left and right hemispheres, respectively, and “Z” denotes electrodes along the sagittal midline. 27 Coherences between bipolar electrode pairs are illustrated as follows: frontal-central sagittal coherences are represented in blue; (1) F8-T8--F7-T7, (2) F4-C4--F3-C3, (3) F3-C3--F8-T8, (4) F4-C4--F7-T7, (5) F3-C3--F7-T7, (6) F4-C4--F8-T8, (7) FZ-CZ--F7-T7, (8) FZ-CZ--F3-C3, (9) FZ-CZ--F8-T8, (10) FZ-CZ--F4-C4. Central-parietal sagittal coherences are represented in red; (11) T8-P8--T7-P7, (12) C4-P4--C3-P3, (13) C3-P3--T8-P8, (14) C4-P4--T7-P7, (15) C3-P3--T7-P7, (16) C4-P4--T8-P8, (17) T7-P7--CZ-PZ, (18) C3-P3--CZ-PZ, (19) T8-P8--CZ-PZ, (20) C4-P4--CZ-PZ, parietal-occipital sagittal coherences are represented in purple; (21) P4-O2--P3-O1. Intrahemispheric lateral coherences are represented in orange; (22) T7-C3--F7-F3, (23) P7-P3--F7-F3, (24) P7-P3--T7-C3, (25) T8-C4--F8-F4, (26) P8-P4--F8-F4, (27) P8-P4--T8-C4.

