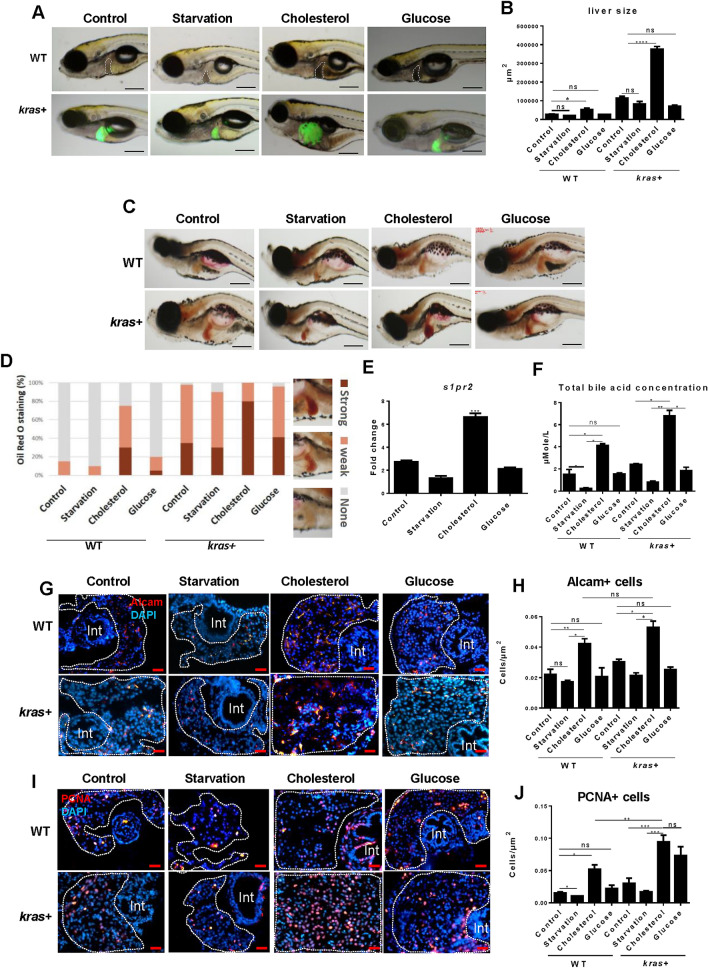
Figure 4.
Effects of differential feeding on liver tumorigenesis. 7-dpf kras+ and WT zebrafish larvae were divided into four groups: control group (normal diet), starvation group (no diet), cholesterol group (10% cholesterol supplement) and glucose group (10% glucose supplement). These larvae were fed in these different regimes till 12 dpf, 20 µg/mL Dox treatment was applied to all groups till 12 dpf for various analyses. (A) Representative images of kras+ and WT larvae (12 dpf) to shows liver size in different feeding groups. Livers were recognized by GFP fluorescence in kras+ larvae and outlined in WT larvae. (B) 2D measurements of liver size in different groups. (C) Representative images of Oil red O staining of the kras+ and WT larvae in different feeding groups. (D) Quantification of Oil red O staining intensity in different groups. Examples of “Strong”, “Weak” and “None” staining are shown on the right of the histogram. (E) Fold change of s1pr2 mRNA expression in kras+ larvae over that of WT larvae in the same feeding regime. (F) Concentrations of total bile acid concentration in zebrafish larvae under different feeding conditions. Total bile acids were determined as µmol/L at 12 dpf. (G–J) Representative images of Alcam (G) and PCNA (I) staining and their quantification (H,J) in different feeding groups. N = 10 per group. Scale bar: 200 μm (A,C) and 20 μm (G,I). Statistical significance: *P˂0.05.

