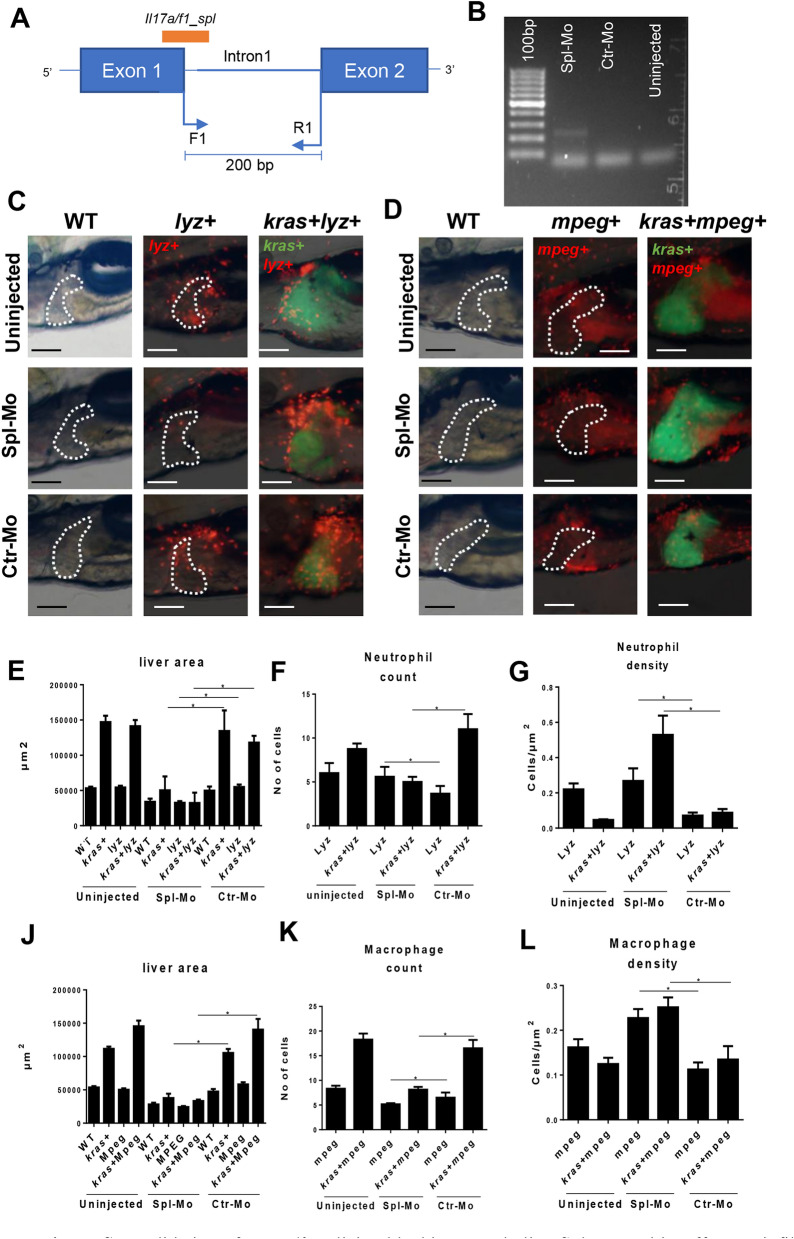
Figure 6.
Validation of iL17a/f1 splicing blocking morpholino Spl-Mo and its effect on infiltration of neutrophils and macrophages in the liver. (A) Diagram of iL17a/f1 gene for the targeted sites of Spl-Mo and PCR primers. A 200-bp fragment is expected when Spl-Mo blocks the splicing. (B) Agarose gel electrophoresis of RT-PCR products after introduction of Spl-Mo. Mopholinos were introduced into zebrafish embryos at one cell stage and RNA was isolated at 6 hpf for RT-PCR analysis. (C, D) Representative images of liver-infiltrated neutrophils (C) and macrophages (D) after il17a/f1 knockdown by Spl-Mo. Lyz+ and mpeg+ transgenic zebrafish were used for marking neutrophils (dsRed expression) and macrophages (mCherry expression) respectively and these transgenic fish were compounded with kras+ zebrafish for investigation of liver-infiltrated immune cells. Livers are outlined for non-kras+ samples. (E–G) Quantification of liver size (E), number (F) and density (G) of liver-infiltrated neutrophils. (J–L) Quantification of liver size (J), number (K) and density (L) of liver-infiltrated macrophages. N = 10 per group. Scale bars: 100 μm. Statistical significance: *P˂0.05.

