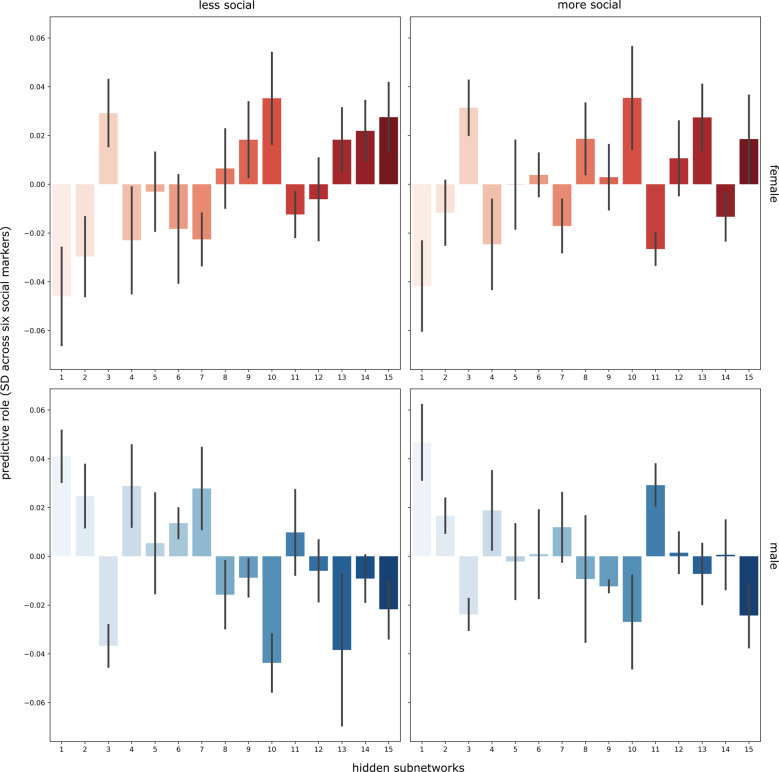
Fig. 6. Overall predictive role of the hidden subnetwork representations for tracking more versus less social exchange.
Across all examined social markers, each bar indicates the predictive contribution (y axis, units on z-scale) of a given subnetwork (x axis) for the degree of sociality in female and male participants. A logistic-loss classification algorithm was trained based on variation in subnetwork expressions across participants to learn predictive patterns for distinguishing the amount of regular social stimulation in men and women (left: less social, right: more social, red: female, blue: male). Involving n = 10,000 UK Biobank participants, our analytical approach thus yielded one set of subnetwork weights for each of the four target groups to be classified (four panels). The obtained classifier weights are summarized across all social traits (error bars for each subnetwork, SD = standard deviation across the six social traits). Individual data points of the prediction weights for degree of sociality for each of the four target groups are shown for each hidden subnetwork in Supplementary Fig. 7. The predictive contributions (y axis) corresponding to each subnetwork (x axis) are shown in each bar. Several subnetworks (e.g., 15, 10, and 1) showed strong predictive contributions across analyzed social traits. These results show good replication in the 40,000 UK Biobank cohort (Supplementary Tables 4–7). In general, the directionality of each prediction weight appears to be more tuned to sex, while the relative differences in prediction weights are more tuned to the richness of social environment. Source data are provided in Supplementary Data 1.

