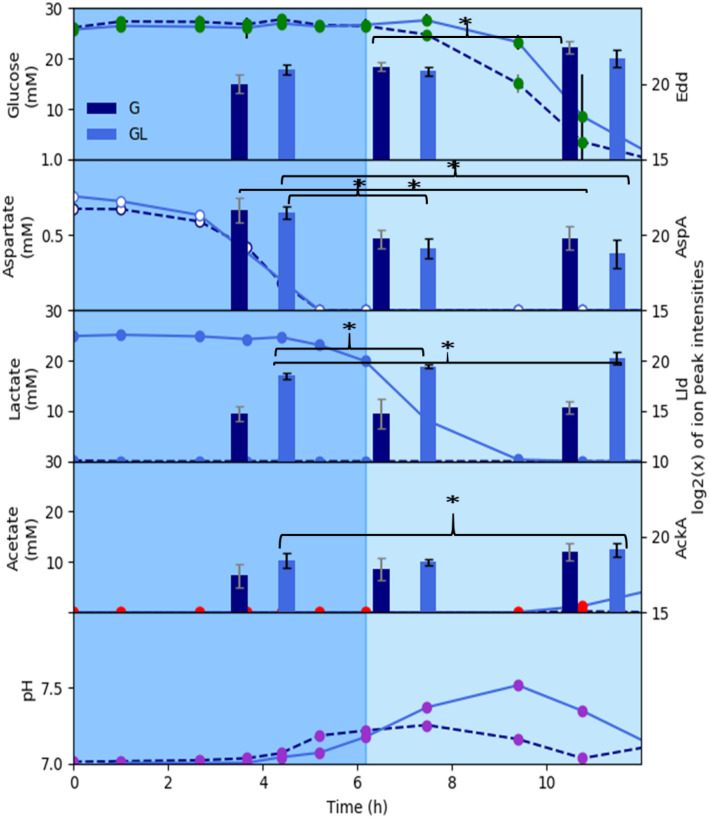
Figure 4.
Substrate-specific, protein abundances for P. aeruginosa 215 cultures grown on chemically-defined CSP G (dark blue bars and dashed lines) and CSP GL (light blue bars and solid lines) media which contain glucose and glucose + lactate, respectively. Substrate concentrations for each enzyme are plotted in the same panel to highlight relationships. The three bars represent batch growth time points 4, 7, and 11 h. Metabolite values are averaged from three biological replicates and two technical replicates. Protein values are averaged from three biological replicates. *p value < 0.05; **p value < 0.01.

