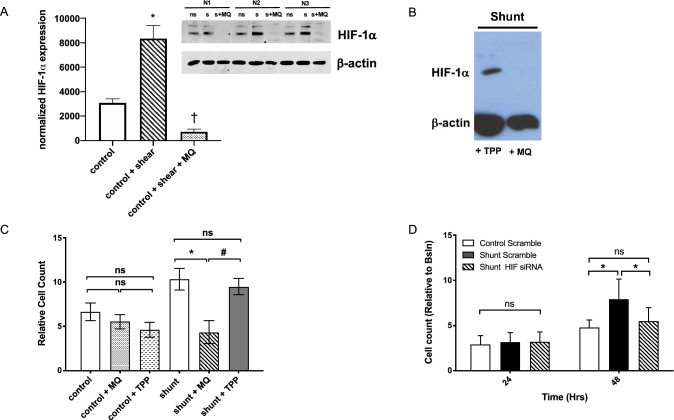
Figure 4.
Mitochondrial ROS stabilize HIF-1α and drive HIF-1α-dependent proliferation in shunt LECs. (A) HIF-1α protein is significantly stabilized in sheared (s) control LECs compared with non-sheared (ns) controls; treatment of sheared control LECs with a mitochondrially targeted antioxidant mitoquinone (s + MQ) abrogates HIF-1α protein stabilization, *, P < 0.05, N = 3 control no shear compared with 3 control + shear; †, P < 0.05, N = 3 control + shear compared with 3 control + shear + MQ; (B) Treatment of shunt LECs with MQ abrogates HIF-1α expression but does not with triphenylphosphonium (TPP), a lipophilic cationic control; NB, each lane is a pooled sample of 3 distinct shunt LEC lines. (C) At 72hrs, treatment of shunt LECs with MQ (angled line bar) slows proliferation to the level observed in control LECs, P > 0.05, whether untreated, + MQ, or + TPP (white, speckled, and inverted caret bars, respectively); *, P < 0.05 compared to untreated shunt LECs (black bar). Treatment of shunt LECs with TPP (solid gray bar) does not change proliferation compared to untreated shunt LECs (black bar), and remains significantly faster than control LECs or shunt LECs treated with MQ, #, P < 0.05. N = 3 control, 3 shunt, for each condition: untreated, + TPP, and + MQ. NB, cell counts normalized to baseline 24 hr timepoint. (D) Knockdown of HIF-1α in shunt LECs (angled line bars) slows proliferation to levels observed in scramble treated controls (white bars), *, P < 0.05 comparing scramble treated control and shunt LECs, or scramble treated shunt LECs and siHIF-1α treated shunt LECs; N = 3 control + scr, 3 shunt + scr, 3 shunt + siHIF-1α. In panels A, C and D, error bars represent standard deviation. For panels A and B, full-length blots/gels are presented in Supplemental Fig. 6.

