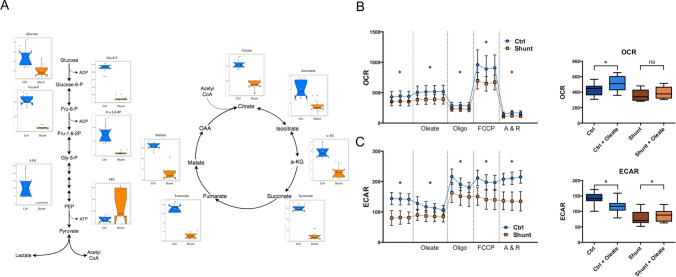
Figure 7.
Untargeted metabolomic and extracellular flux analyses demonstrate metabolic abnormalities in shunt LECs. (A) Significantly differing metabolites of glycolysis and the TCA cycle in shunt and control LECs by untargeted metabolomic analysis. N = 3 control, 3 shunt. Values expressed as peak intensities with modified vector normalization to the sum of peak heights for all identified metabolites (mTIC) per sample. Data are presented side-by-side as individual data points mapped over notched box and whisker plots with waist at the 50th percentile and edges at the 25th and 75th percentiles respectively. Notch width displays a confidence interval around the median based on the median + / − 1.57 × IQR/sqrt of n. All displayed metabolites exhibit significant differences based on student’s t test with P < 0.05 adjusted for multiple comparisons using a Bonferroni correction. (B) Oxygen consumption rate (OCR, pmol O2/min/100,000 cells) and (C) Extracellular acidification rate (ECAR mpH/min/100,000 cells) comparisons of shunt (orange squares) and control (blue circles) LECs with N = 2 for each of these representative experiments. For each, repeated measurements are shown for the basal condition and following sequential addition of the metabolites and drugs noted on the x-axis, and separated by dotted vertical lines. For each condition, * denotes a significant difference between pooled values for shunt and control LECs with P < 0.05. Also shown is the change in OCR (B) and ECAR (C) between conditions (basal and following addition of exogenous bioavailable oleic acid) for control and shunt LECs. Pooled values for each condition are presented as box and whisker plots, with * denoting a significant within group difference across conditions with P < 0.05.

