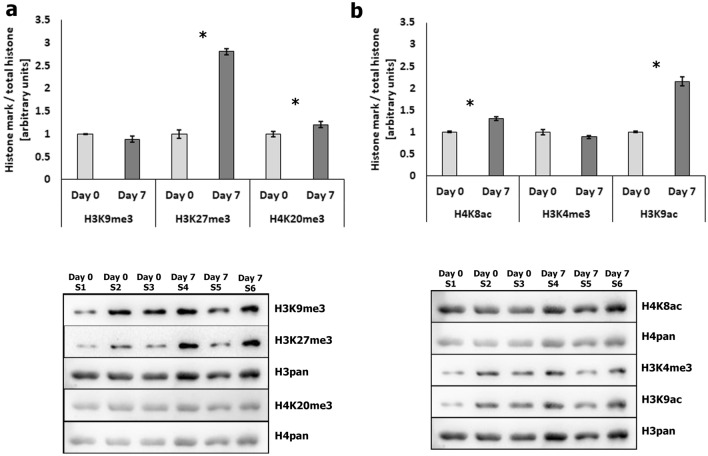
Figure 3.
Western blot analysis of histone modification levels during adipogenesis. (a) The abundance of H3K9me3, H3K27me3, and H4K20me3 modifications in undifferentiated cells (day 0) and adipocytes (day 7). Statistically significant differences (P < 0.05) are marked with asterisks. (b) Abundance of H4K8ac, H3K4me3, and H3K9ac histone modifications in undifferentiated cells (day 0) and adipocytes (day 7). Statistically significant differences (P < 0.05) are marked with asterisks. Full length blots are presented in Supplementary Figures S4 and S5.

