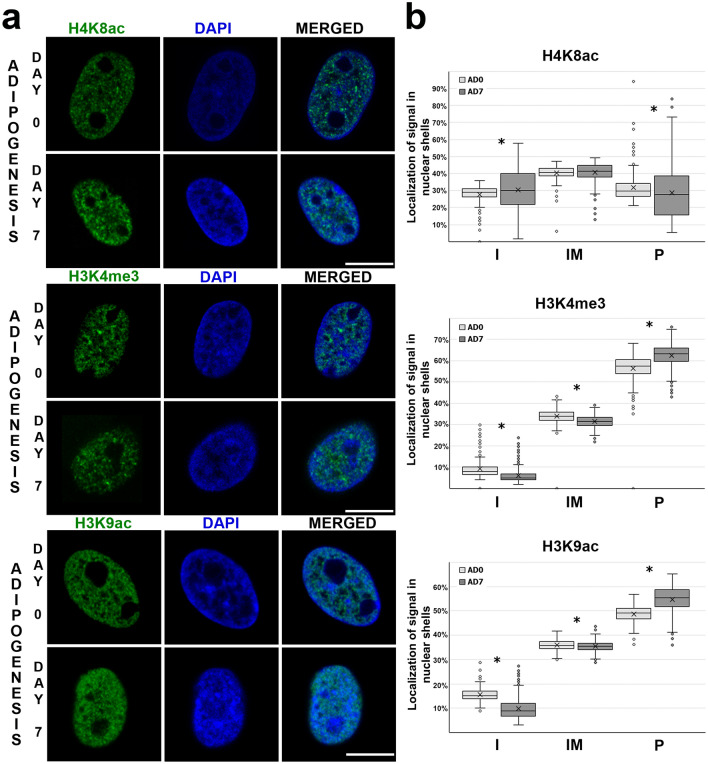
Figure 5.
Spatial distribution of selected histone marks associated with euchromatin. (a) Distribution of H4K8ac, H3K4me3, and H3K9ac in a 3D nuclear space on days 0 and 7 of in vitro adipogenesis. The histone marks were visualized by indirect immunofluorescence (green). Nuclei were counterstained with DAPI (blue). Scale bar: 10 µm. (b) The graphs show the spatial distribution of immunofluorescent signals in 3D nuclear space. Statistically significant differences (P < 0.05) are marked with asterisks. Number of nuclei analyzed: H4K8ac: n = 551, H3K4me3: n = 594, H3K9ac: n = 653. Statistical data are shown in Supplementary Table 2.

