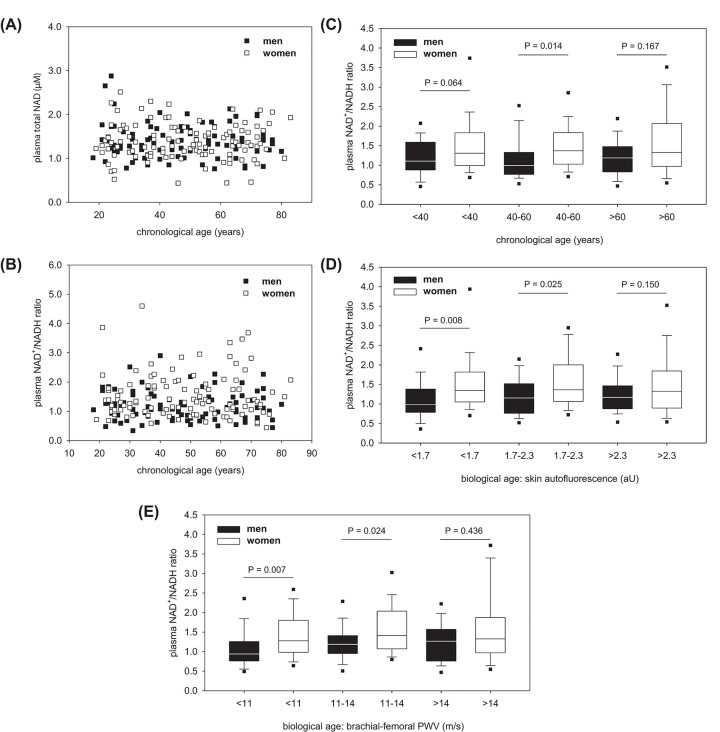
Figure 3. Age dependency of the plasma NAD level.
Plasma values for total NAD (A) and the NAD redox ratio (B) depending on chronological age of men and women. Data are shown as dot plots. No regression found. Influence of chronological (C) and biological age (D,E) on the sex-related plasma NAD+/NADH ratios. All data are shown as box plot with whiskers and 5th/95th percentiles. In (C), the subgroups contained n=36, 31 and 24 men as well as 41, 38 and 35 women (black or with plots from left to right). In (D), the subgroups contained n=22, 43 and 26 men as well as 38, 42 and 34 women. In (E), the subgroups contained n=31, 38 and 22 men as well as 42, 37 and 35 women. P-values were calculated by the Rank-sum test.

