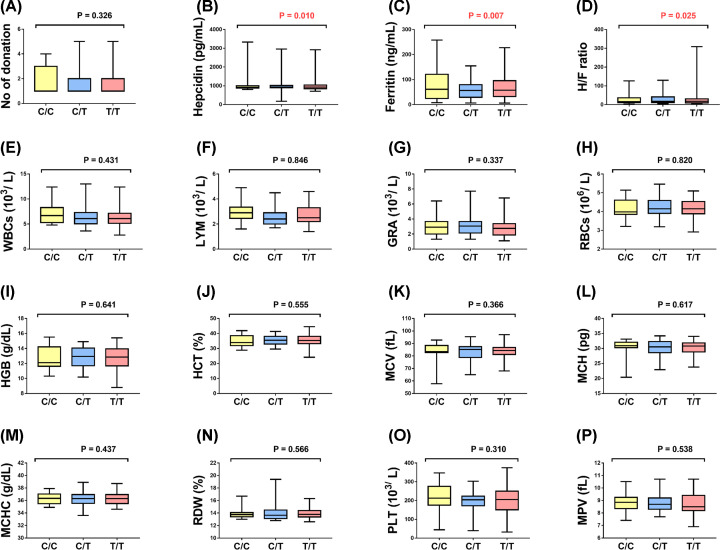
Figure 3. Association between rs9357271 BTBD9 and laboratory results.
(A) Number (No) of donation, (B) Serum hepcidin (pg/ml), (C) Serum ferritin (ng/ml), (D) Serum hepcidin/ ferritin ratio, (E) White blood cells count (103/L), (F) Lymphocyte count (103/L), (G) Granulocytes count (103/L), (H) Red Blood Cells count (106/L), (I) Hemoglobin level (g/dl), (J) Hematocrit concentration (%), (K) Mean cell volume, (L) Mean cell hemoglobin (pg), (M) Mean cell hemoglobin concentration (g/dl), (N) Red cell distribution width (%), (O) Platelets count (103/L), (P) Mean Platelet Volume (fL). Box plots represent median and quartile values. Mann–Whitney U test was used. P<0.05 was set to be statistically significant. Abbreviations: FER, ferritin; GRA, granulocytes; HCT, hematocrit; HEP, hepcidin; H/F, hepcidin/ferritin ratio; HGB, hemoglobin; LYM, lymphocyte; MCH, mean cell hemoglobin; MCHC, mean cell hemoglobin concentration; MCV, mean red cell volume; MPV, mean platelet volume; PLT, platelets; RBC, red blood cells; RDW, red cell distribution width; WBC, white blood cells.

