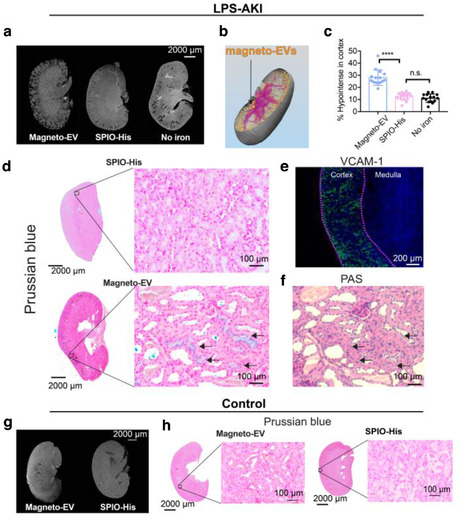
FIGURE 3.

Distribution of magneto‐EVs in the injured kidney in the LPS‐AKI model. (a) Different distribution patterns of magneto‐EVs (left) and SPIO‐His (middle) in representative LPS‐AKI kidneys, as revealed by ex vivo high‐resolution MRI. Image of a representative non‐injected kidney on the right is shown as a control reference. (b) 3D reconstruction of a representative kidney showing the distribution of magneto‐EVs (gold‐coloured dots). Blood vessels are shown in purple colour (see also Supplementary Video 3). (c) Quantitative comparison of the relative hypointense areas (%) in the cortex of AKI mice injected with magneto‐EVs, SPIO‐His, or without injection (**** P < 0.0001, unpaired Student's t‐test, n = 15). (d) Prussian blue stains showing the distribution of magneto‐EVs and SPIO in the injured kidney (Left: whole kidney; Right: zoom‐in; Blue = SPIO; Red = nucleus). (e) VCAM‐1 staining of a representative kidney showing extensive inflammation (green) occurring in the cortex. Tissue was counterstained with DAPI (blue). (f) Periodic acid–Schiff (PAS) staining of the section corresponding to the Prussian blue stain on the left. (g) Distribution of magneto‐EVs (left) and SPIO‐His (right) in a representative normal control kidney. (h) Prussian blue stains showing the distribution of magneto‐EVs and SPIO‐His in uninjured kidney (Left: whole kidney; Right: zoom‐in; Blue = SPIO; Red = nucleus)
