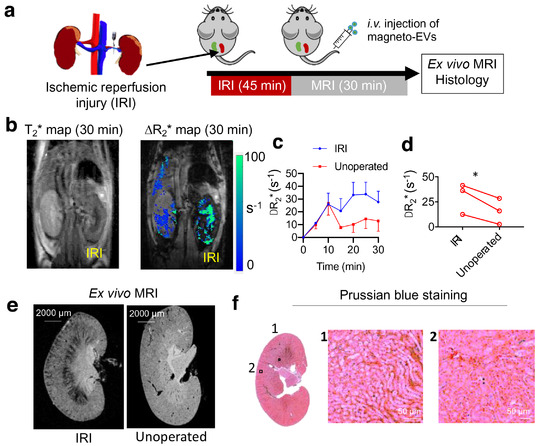
FIGURE 4.

MRI tracking of i.v. administered magneto‐EVs in the IRI‐AKI model. (a) Schematic illustration of the experimental IRI‐AKI model and MRI acquisition. (b) Representative in vivo T2* image and ΔR2* map at 30 min after EV injection. (c) Dynamic ΔR2* MRI value changes in IRI and non‐operated control kidneys (n = 3 in each group). (d) Comparison of ΔR2* (30 min) values in IRI and control kidney for each mouse (* P = 0.04, two‐tailed paired Student's t‐test, n = 3). (e) Ex vivo high‐resolution T2*w MR image of a representative IRI kidney and unoperated kidney. (f) Corresponding Prussian blue staining (Left: whole kidney; Right: zoom‐in; Blue = SPIO; Red = nucleus
