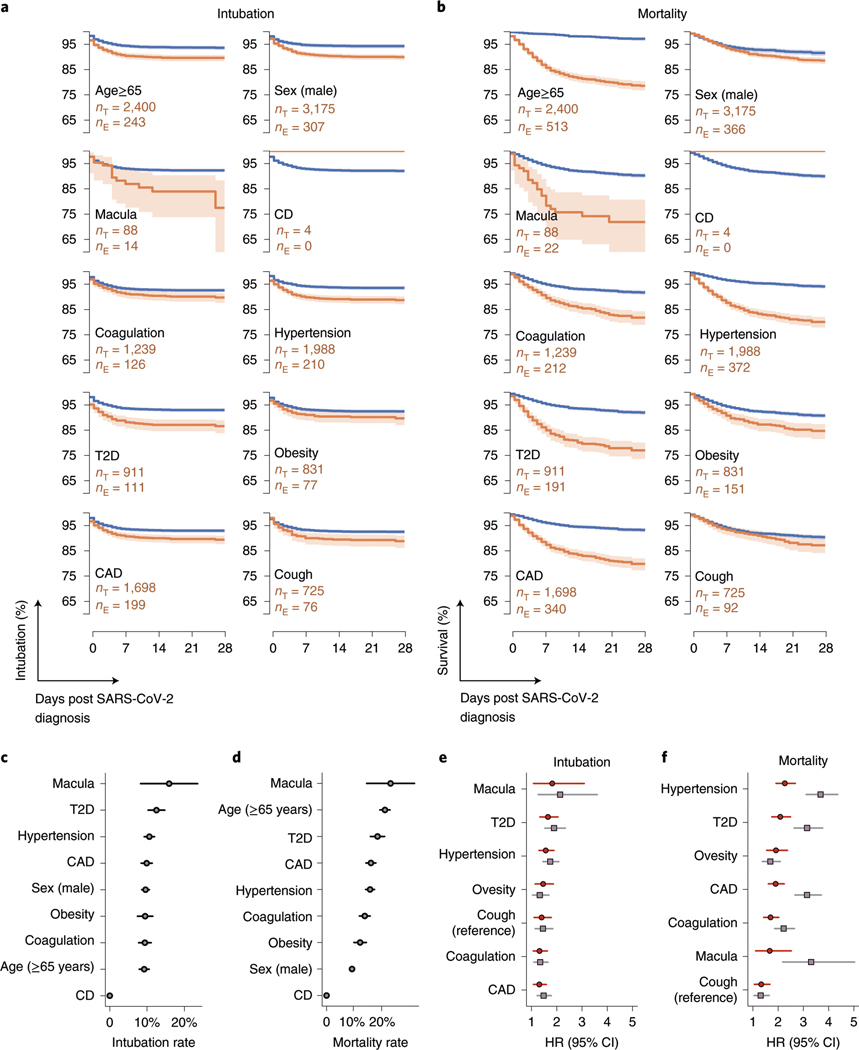
Fig. 1 |. History of macular degeneration and coagulation disorders are associated with adverse outcomes after confirmed SARS-CoV-2 infection.
a, Kaplan–Meier curves (line, proportion of subjects that did not require intubation; error band, 95% CI (Greenwood’s)) for ten binary conditions: age > 65 years, male sex, macular degeneration (macula), complement deficiency disorders (CD), coagulation, hypertension, T2D, obesity, CAD and cough. The survival rates for the patients with the named condition are shown in orange (sample size is given as nE). The shaded region indicates the 95% CI. The blue survival line is for patients without the named condition (sample size is given as nT). Note that none of the four patients with CD required mechanical ventilation. b, Kaplan–Meier curves (line, proportion of subjects that survived; error band, 95% CI (Greenwood’s)) for the same ten conditions as in a. All four patients with CD survived (not statistically significant). c, Intubation rates across the binary conditions. Intubation was highest in patients with a history of macular degeneration (n = 14), followed by T2D (n = 111) and hypertension (n = 210). Error bars indicate binomial 95% CIs. d, Mortality rates across the binary conditions. Patients with a history of macular degeneration saw the highest mortality rates (n = 22), followed by age ≥ 65 (n = 513) and T2D (n = 191). Error bars indicate binomial 95% CI. e, HRs, estimated using a Cox proportional hazards model, for risk of intubation (as a validated proxy for requiring mechanical respiration). Sample sizes are the same as in a, and error bars represent 95% CI derived from the s.e.m. f, Similarly, HRs for mortality, estimated using a Cox proportional hazards model. HRs and statistical significances are shown in Table 1. Sample sizes are the same as in b, and error bars represent 95% CI derived from the s.e.m.

