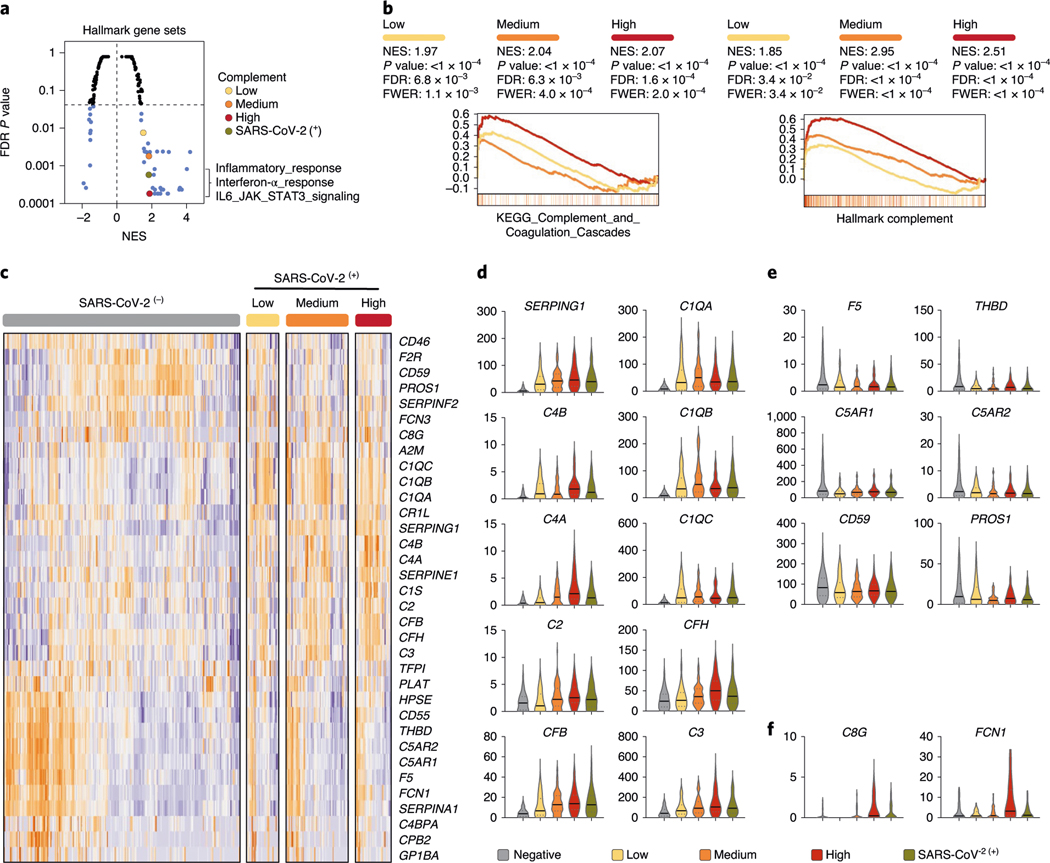
Fig. 2 |. SARS-CoV-2 infection engages robust transcriptional regulation of complement and coagulation cascades.
a, GSEA of Hallmark gene sets was applied to RNA-seq profiles of NP swabs from 650 control and SARS-CoV-2-infected patients stratified by SARS-CoV-2 positive (green) or low (yellow), medium (orange), high (red) viral load (significantly enriched gene sets highlighted in blue). b, Leading edge enrichment plots from GSEA analysis of MsigDB-wide gene sets are shown for Hallmark_Complement and KEGG_Complement_and_Coagulation_Cascade gene sets with SARS-CoV-2 stratification indicated by color. c, Hierarchical clustering of z score normalized mRNA profiles of complement and coagulation components that undergo significant (FDR corrected P < 0.01) transcriptional regulation in response to SARS-CoV-2 infection (cold and hot color scale reflects downregulated or upregulated expression, respectively). d–f, Violin plots indicating median and quartiles as well as minima and maxima bounds (TPM, transcripts per million, shown on y axis) of highlighted differentially regulated genes are shown for upregulated (d), downregulated (e) or particularly upregulated expression in the context of high viral load (f). Normalized enrichment scores (NES) and FDR-corrected P values are shown. Two-tailed Mann–Whitney U-test P values are reported.

