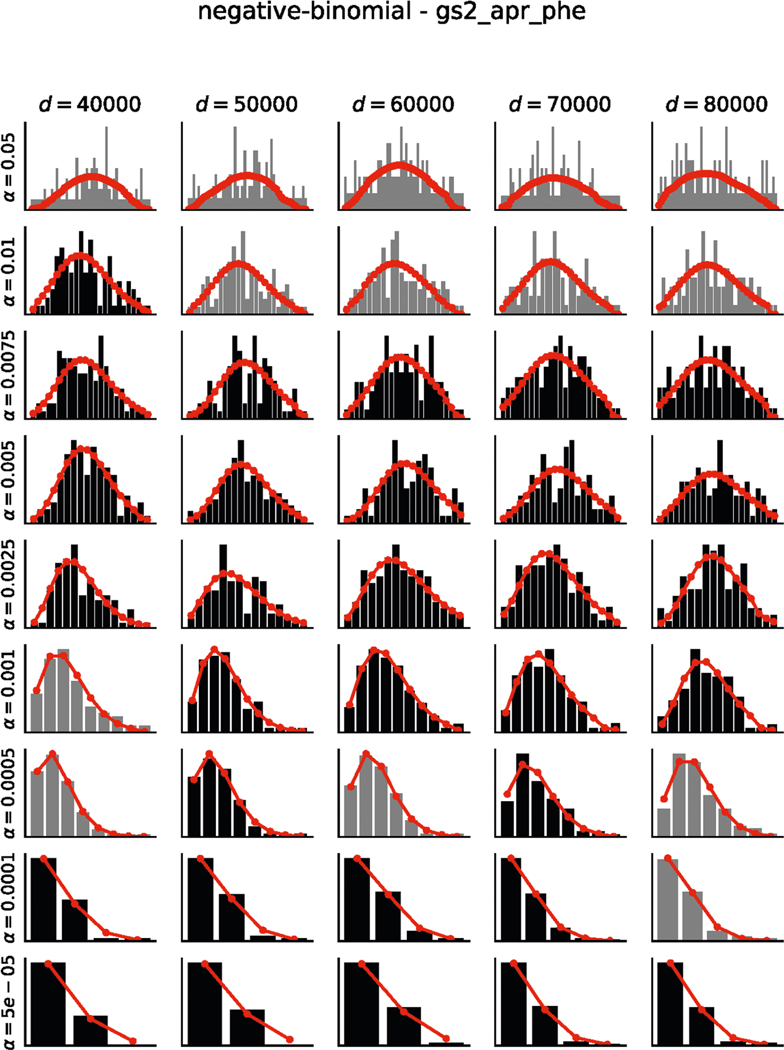
Extended Data Fig. 2 |. Results of permutation testing and fits to negative binomial distributions for April-2020 phenotype permutations.
Histograms indicate the number of permutations with X significant hits (black/grey bars). Negative binomial fits are shown in red (see Methods). Chi-squared goodness-of-fit tests were performed for each distribution. Distributions which passed the goodness-of-fit test (p > 0.05) are shown in black and those that failed (p ≤ 0.05) are shown in grey. Results are visualized for 5 distances (columns) and 9 alpha thresholds (rows). All fits are available as supplement data.

