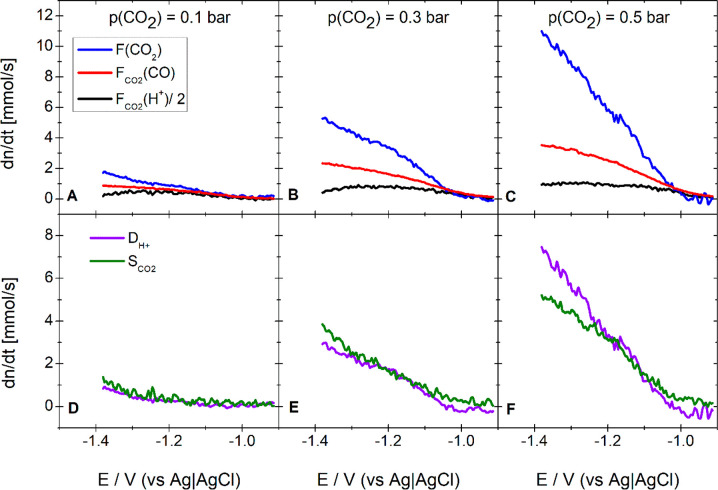
Figure 4.
Top panels: Flux of protons divided by 2 (black), of CO2 (blue), and of CO (red) that are consumed and produced during CO2 reduction, respectively. Bottom panels: Proton deficit (violet) and CO2 surplus (olive). The electrolyte was 0.5 M NaClO4 + 1 mM HClO4 purged with an Ar/CO2 gas mixture featuring a CO2 partial pressure of 0.1 bar (A and D), 0.3 bar (B and E), and 0.5 bar (C and F). Working electrode: Au(pc) (roughness factor, 20.3; exposed geometric surface, area 0.283 cm2). Sweep rate: 20 mV/s. Flow rate: 5 μL/s.

