Figure 3.
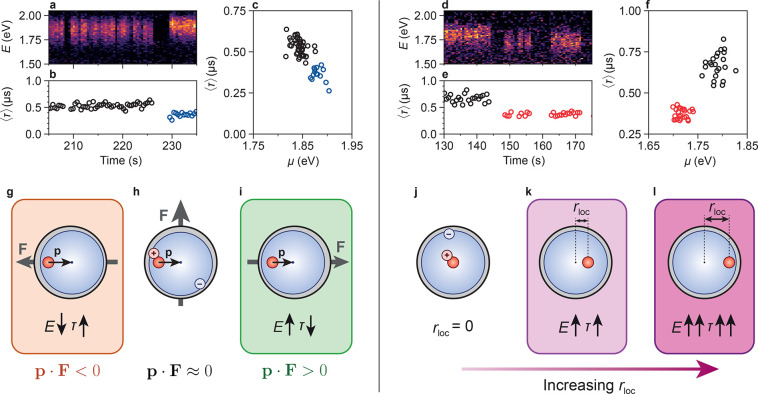
Single-QD (a) PL spectra and (b) average photon delay time ⟨τ⟩, as a function of time. (c) Correlation of average photon delay time ⟨τ⟩ and fitted peak position μ. The color scale in panel a (black to purple to yellow) indicates PL intensity. (d–f) The same as in panels a–c but for a different QD. (g–i) Schematic depiction of spectral diffusion induced by the quantum-confined Stark effect. Mobile surface atoms or ligands create a fluctuating electric field F. We depict three possible orientations with respect to the excited-state dipole p: (g) antiparallel, (h) orthogonal, and (i) parallel. (j–l) Schematic depiction of spectral diffusion due to changes in the hole localization site rloc. Effects on the exciton energy E and lifetime τ are indicated in the cartoons.

