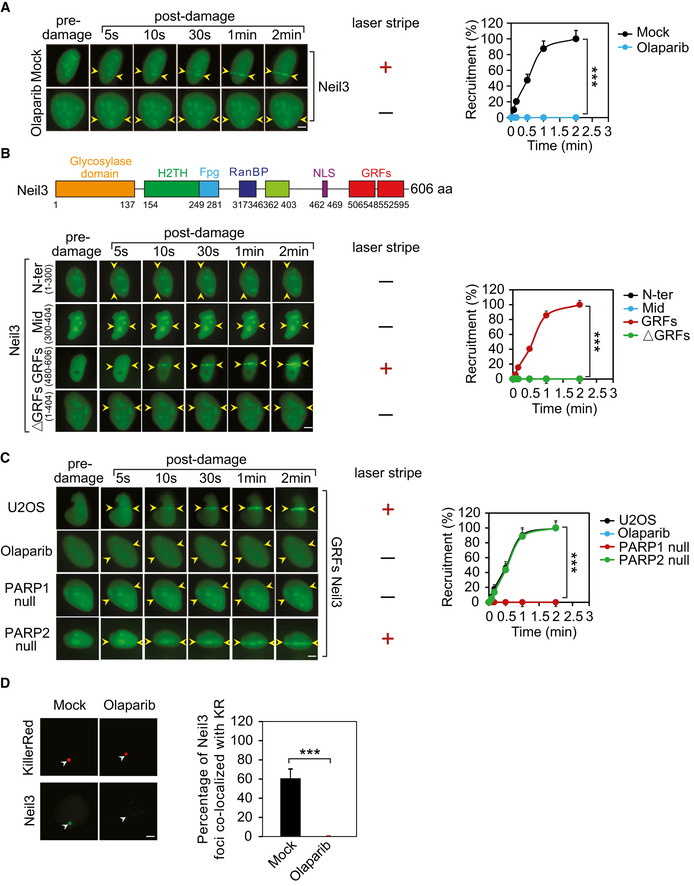
ADP‐ribosylation mediates the recruitment of Neil3. GFP‐Neil3 was expressed in U2OS cells, and cells were treated with olaparib (1 µM, 1 h) or mock (0.1% DMSO in medium, 1 h). Following laser microirradiation treatment, the recruitment of Neil3 was examined with live‐cell imaging at the indicated time points (left panel). The laser stripe is indicated with yellow arrowheads. The relocation kinetics is shown in the right panel. Data represent mean ± SD from three biologically independent experiments (right panel). At least 20 cells were included in each experiment. P‐values were calculated using Student’s t‐test. ***P < 0.001. Scale bar, 2 μm.
The GRFs of Neil3 alone are sufficient to be recruited to the sites of DNA damage. Truncated mutants of Neil3 were generated and fused with a GFP tag. Following laser microirradiation treatment, the recruitment of truncated mutants Neil3 was examined with live‐cell imaging at the indicated time points (left panel). The laser stripe is indicated with yellow arrowheads. The relocation kinetics is shown in the right panel. Data represent mean ± SD from three biologically independent experiments (right panel). At least 20 cells were included in each experiment. P‐values were calculated using Student’s t‐test. ***P < 0.001. Scale bar, 2 μm.
PARP inhibitor treatment (olaparib: 1 µM, 1 h) or lack of PARP1 suppresses the relocation of the GRFs of Neil3 to the DNA lesions. The laser stripe is indicated with yellow arrowheads. The relocation kinetics is shown in the right panel. Data represent mean ± SD from three biologically independent experiments (right panel). At least 20 cells were included in each experiment. P‐values were calculated using Student’s t‐test. ***P < 0.001. Scale bar, 2 μm.
The recruitment of Neil3 to the oxidative lesions is inhibited by olaparib treatment (1 µM, 1 h). 0.1% DMSO in medium for 1 h as mock. Oxidative damage was induced by KillerRed (KR) system with the exposure to a 15‐W SYLVANIA cool white fluorescent bulb for 10 min. Scale bar, 2 μm. The foci were indicated with white arrowheads. Right panel: the percentage of Neil3 foci co‐localized with KR was quantified. Mean value with SD is from 20 cells. P‐values were calculated using Student’s t‐test. ***P < 0.001.

