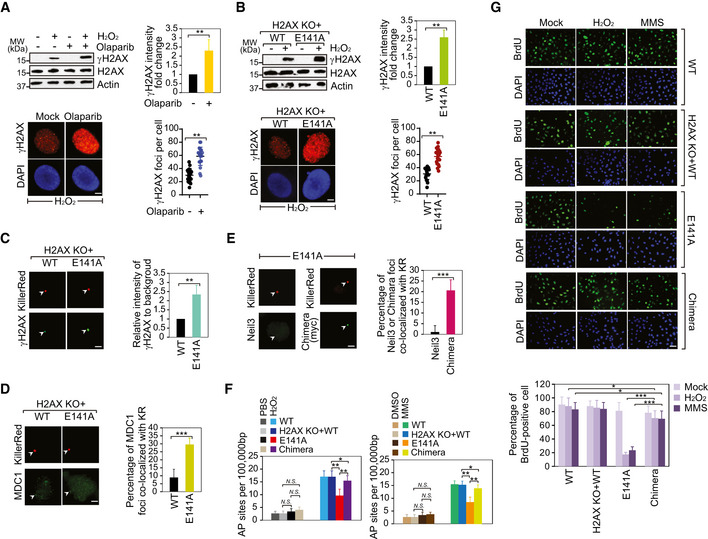
Figure 5. ADP‐ribosylation of H2AX suppresses γH2AX.

- PARP inhibition facilitates γH2AX following oxidative stress. The cells were pre‐treated with olaparib (1 µM, 1 h) prior to H2O2 stimulation. 0.1% DMSO in medium for 1 h as mock. γH2AX or H2AX was detected using Western blotting and immunostaining assays. The intensity of γH2AX levels was examined by Western blotting normalized by β‐actin and averaged. Values are mean ± SD of three assays. P‐values were calculated using Student’s t‐test. **P < 0.01 (left panel). The number of γH2AX foci examined in immunostaining assay was counted by ImageJ software and graphed by GraphPad Prism 8. Values are mean ± SD of three assays. P‐values were calculated using Student’s t‐test. **P < 0.01 (right panel). Scale bar, 2 μm.
- The effect of H2AX E141 ADP‐ribosylation on γH2AX following oxidative stress. γH2AX or H2AX was detected using Western blotting and immunostaining assays. The intensity of γH2AX levels was examined by Western blotting normalized by β‐actin and averaged. Values are mean ± SD of three assays. P‐values were calculated using Student’s t‐test. **P < 0.01 (left panel). The number of γH2AX foci examined in immunostaining assay was counted by ImageJ software and graphed by GraphPad Prism 8. Values are mean ± SD of three assays. P‐values were calculated using Student’s t‐test. **P < 0.01 (right panel).
- The intensity of γH2AX is increased in cell expressing the E141A mutant following KillerRed‐induced oxidative DNA lesions (left panel). Scale bar, 2 μm. The foci were indicated with white arrowheads. Scale bar, 0.5 μm. Right panel: the relative intensity of γH2AX at the site of tetR (intensity of γH2AX at the site of tetR/intensity of γH2AX area away from tetR) was quantified. Mean value with SD is the relative intensity of γH2AX in 20 cells. P‐values were calculated using Student’s t‐test. **P < 0.01.
- The level of MDC1 at KillerRed‐induced oxidative DNA lesions is increased in the cells expressing the E141A mutant (left panel). Scale bar, 2 μm. The foci were indicated with white arrowheads. Right panel: the percentage of MDC1 foci co‐localized with KR was quantified. Mean value with SD is from 20 cells. P‐values were calculated using Student’s t‐test. ***P < 0.001.
- The recruitment of Neil3/MDC1 chimera but not wild‐type Neil3 to the KR‐induced oxidative lesions in cells expressing the E141A mutant (left panel). Neil3/MDC1 chimera: replaced the GRFs of Neil3 with the tandem BRCT domains of MDC1. Scale bar, 2 μm. The foci were indicated with white arrowheads. Right panel: The percentage of detected protein foci co‐localized with KR was quantified. Mean value with SD is from 20 cells. P‐values were calculated using Student’s t‐test. ***P < 0.001.
- AP sites were measured in cells expressing the E141A mutant or the Neil3/MDC1 chimera, according to the standard curve. Values are mean ± SD of three assays. P‐values were calculated using Student’s t‐test. N.S.: nonsignificant, *P < 0.05, and **P < 0.01.
- DNA replication of U2OS cell expression with individual wild type (WT), the H2AX KO + WT, the E141A mutant (E141A), or the Neil3/MDC1 Chimera (Chimera) was analyzed by BrdU incorporation following treatment with H2O2, MMS, or mock (PBS). Represented images are shown in the left panel. The graph shows percentages of BrdU‐positive cells expressing WT, E141A, or Chimera (right panel). Values are mean ± SD of three assays. P‐values were calculated using Student’s t‐test. *P < 0.05 and ***P < 0.001. Scale bar, 30 μm.
Source data are available online for this figure. Source data are available online for this figure.
