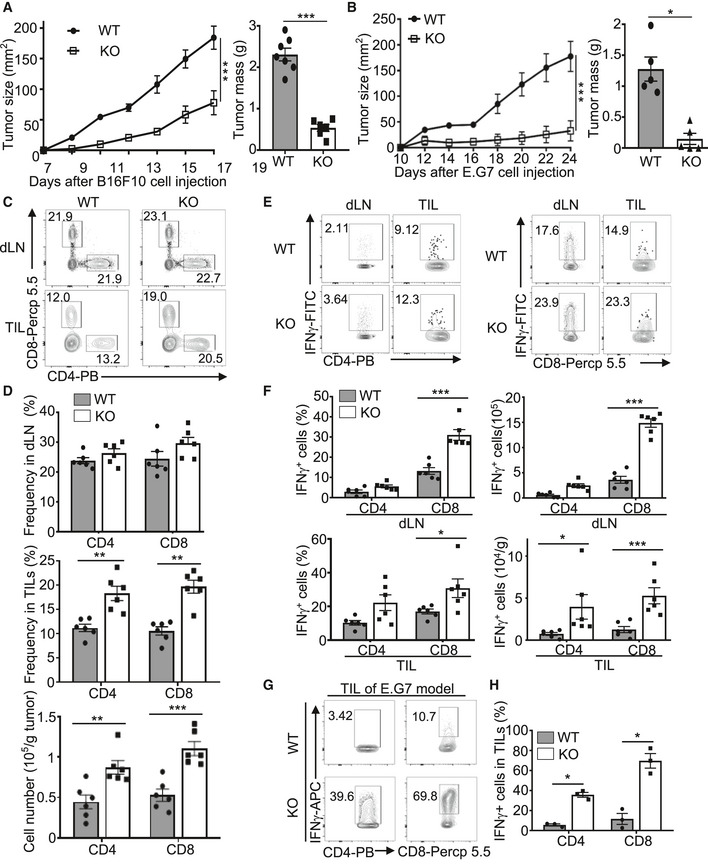
Figure 1. Peli1 deficiency promotes antitumor immunity.

-
A, BTumor growth curve (left) and summary of end‐point tumor masses (right) of 6‐8 week‐old wild‐type (WT) and Peli1‐KO (KO) mice inoculated s.c. with B16F10 (A; WT, n = 7; KO, n = 6) or E.G7 (B; WT, n = 5; KO, n = 5) tumor cells.
-
C, DFlow cytometry analysis of CD4+ and CD8+ T cells in CD45.2+ TILs and dLN cells from B16F10 tumor‐bearing wild‐type and Peli1‐KO mice, presented as a representative plot (C) and summary graph based on multiple mice (D; WT, n = 6; KO, n = 6).
-
E, FFlow cytometry analysis of IFNγ‐producing CD4+ and CD8+ T cells in TILs, and dLN cells of B16F10 tumor‐bearing (day 19) wild‐type and Peli1‐KO mice, presented as a representative plot (E) and summary graph (F). (WT, n = 6; KO, n = 6).
-
G, HFlow cytometry analysis of IFNγ+CD8+ T cells in TILs of E.G7 tumor‐bearing (day 24) wild‐type and Peli1‐KO mice, presented as a representative plot (G) and summary graph (H). (WT, n = 3; KO, n = 3)
Data information: Data are representative of 3 independent experiments, and bar graphs are presented as mean ± SEM with P values being determined by a two‐way ANOVA with Bonferroni correction (left panel of A and B) and two‐tailed unpaired Student’s t‐test (right panel of A and B; D, F, H). *P < 0.05; **P < 0.01; ***P < 0.001.
