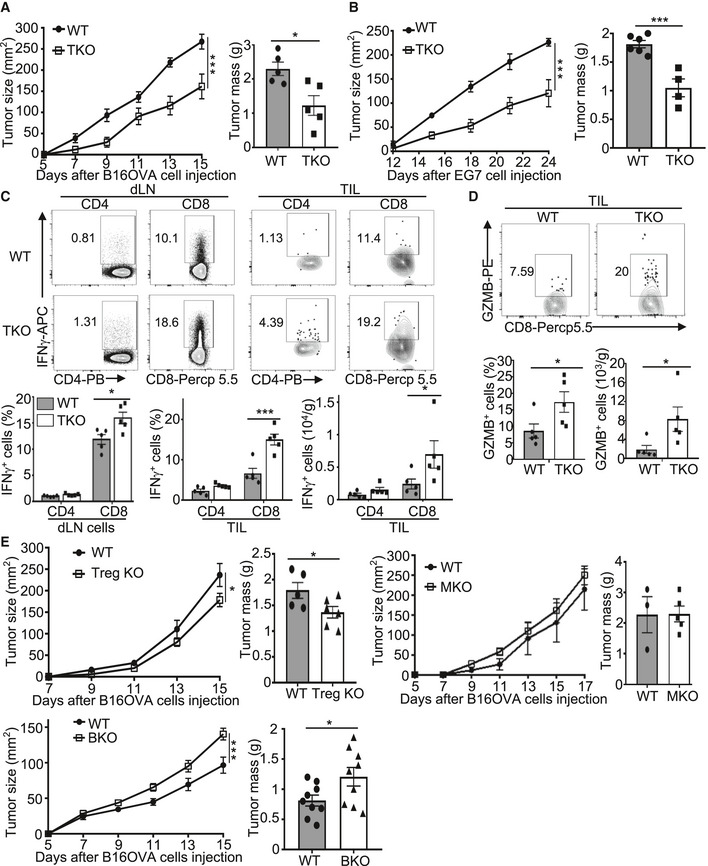
Figure 2. T cell‐specific Peli1 deficiency promotes antitumor immunity.

-
A, BTumor growth curve (left) and summary graph of end‐point tumor masses (right) of wild‐type (WT) and Peli1‐TKO (TKO) mice inoculated s.c. with B16‐OVA (A; WT, n = 5; KO, n = 5) or E.G7 (B; WT, n = 6; KO, n = 4) tumor cells.
-
CFlow cytometry analysis of IFNγ‐producing CD4+ and CD8+ T cells in TILs and dLN cells from B16OVA tumor‐bearing wild‐type and Peli1‐TKO mice, presented as a representative plot (upper) and summary graph (lower). (WT, n = 5; KO, n = 5)
-
DFlow cytometry analysis of GZMB+CD8+ T cells in TILs from B16‐OVA tumor‐bearing wild‐type and Peli1‐TKO mice, presented as a representative plot (upper) and summary graph (lower). (WT, n = 5; KO, n= 5)
-
ETumor growth curve (left) and summary graph of end‐point tumor masses (right) of B16‐OVA tumor‐bearing wild‐type and the indicated Peli1 conditional KO mice. (Treg KO model: WT, n= 5; Treg KO, n = 6; MKO model: WT, n= 3; MKO, n = 5; BKO model: WT, n = 9; BKO, n = 9)
Data information: Data are representative of 2 (E) or 3 (A‐D) independent experiments, and bar graphs are presented as mean ± SEM. P values are determined by a two‐way ANOVA analysis with Bonferroni correction (left panel of A, B, E) and two‐tailed unpaired Student’s t‐test (C, D and right panel of A, B, E). *P < 0.05; ***P < 0.001.
