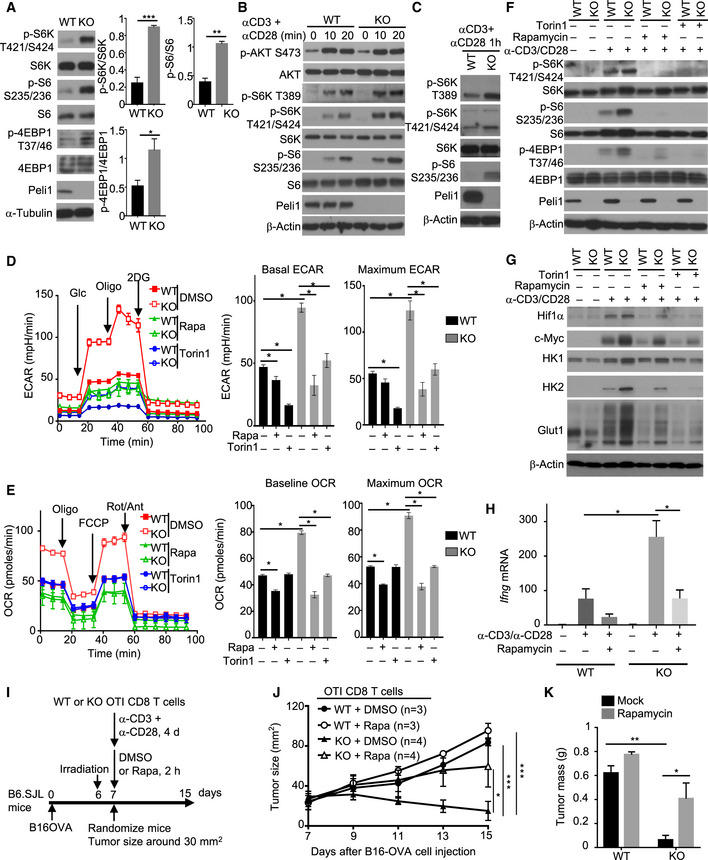
Figure 4. Peli1 deficiency promotes mTORC1 signaling in CD8 T cells.

-
AImmunoblot analysis of the indicated phosphorylated (p‐) and total proteins in whole‐cell lysates of freshly isolated CD8 T cells from wild‐type (WT) or Peli1 KO (KO) mice (6 weeks old). Data are presented as a representative blot (left) and summary graphs of densitometric quantifications of the indicated proteins (presented as phosphorylated/total protein ratio) based on three independent experiments.
-
B, CImmunoblot analysis of the indicated phosphorylated (p‐) and total proteins in whole‐cell lysates of wild‐type or Peli1‐KO OT‐I CD8 T cells that were first rested on ice for 15 min and then stimulated in low‐serum (1% FBS) medium with anti‐CD3 and anti‐CD28 for the indicated time periods.
-
D, ESeahorse analysis of basal and maximal ECAR (D) or OCR (E), as described in Fig 3, using wild‐type or Peli1‐KO OT‐I CD8 T cells that were activated for 16 h with plate‐bound anti‐CD3 (1 μg/ml) plus anti‐CD28 (1 μg/ml) in the presence of solvent control (DMSO), rapamycin (Rapa, 10 nM), or Torin 1 (100 nM). Data are presented as a representative plot (left) and summary graphs (right).
-
F, GImmunoblot analysis of the indicated phosphorylated (p‐) and total proteins in whole‐cell lysates of wild‐type or Peli1‐KO OT‐I CD8 T cells that were either not treated (–) or stimulated (+) for 1 h (F) or 24 h (G) with anti‐CD3 (1 μg/ml) and anti‐CD28 (1 μg/ml) in the presence (+) or absence (–) of rapamycin (10 nM) and Torin 1 (100 nM).
-
HqRT–PCR analysis of Ifng gene expression in naïve wild‐type or Peli1‐KO OT‐I CD8 T cells that were either not treated (–) or stimulated for 6 h (+) with anti‐CD3 plus anti‐CD28 in the presence (+) or absence (–) or rapamycin.
-
I–KSchematic of experimental design (I), tumor growth curve (J), and summary of day 15 tumor weight (K) of B6.SJL mice inoculated with B16‐OVA melanoma cells (2 x 10⁵) and adoptively transferred on day 7 with in vitro activated and rapamycin‐ or DMSO‐treated wild‐type or Peli1‐KO OT‐I CD8 T cells (4 × 10⁵).
Data information: Data are representative of 2 (J, K) or 3 (A‐H) independent experiments and bar graphs are presented as mean ± SEM with P values being determined by two‐tailed unpaired Student’s t‐test (A, D, E, H, K) or two‐way ANOVA with Bonferroni correction (J). *P < 0.05; **P < 0.01; ***P < 0.001.
Source data are available online for this figure.
