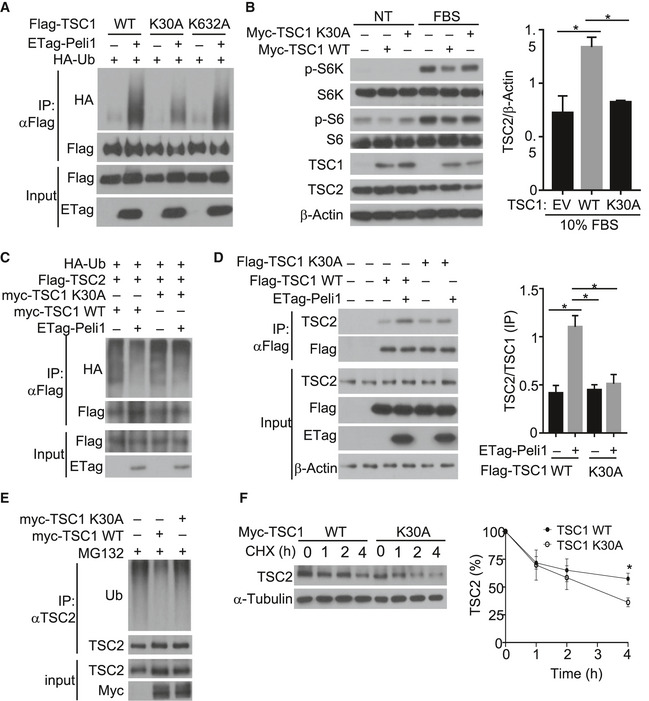
Figure 7. Peli1 regulates the stability of TSC complex through ubiquitination of TSC1.

- Analysis of ubiquitin conjugation to wild‐type (WT) TSC1 and the indicated TSC1 mutants in 293T cells transiently transfected Flag‐tagged TSC1 and its mutants along with (+) or without (–) the indicated expression vectors.
- Immunoblot analysis of the indicated phosphorylated (p‐) and total proteins in lysates of TSC1‐KO MEFs transfected with (+) or without (–) TSC1 wild‐type or K30A expression vectors. The cells were serum starved and then left either untreated (NT) or stimulated with 10% FBS for 30 mins. Data are presented as a representative blot (left panel) and a summary graph of quantified TSC2 (right panel) protein bands relative to the level of β‐Actin.
- Analysis of TSC2 ubiquitination in 293 cells transfected (for 48 h) with (+) or without (–) the indicated expression vectors.
- Co‐immunoprecipitation analysis of the interaction between endogenous TSC2 and exogenous TSC1 wild‐type and K30A in TSC1‐KO MEFs transfected (for 48 h) with (+) or without (–) the indicated expression vectors. KO MEF cells were transfected with indicated expression plasmids. The right panel is a summary graph of TSC2/TSC1 ratio based on quantification of the last four lanes of the anti‐Flag IP blot in left panel.
- Analysis of ubiquitin conjugation to endogenous TSC2 in TSC1‐KO MEFs transfected (for 48 h) with (+) or without (−) TSC1 WT or K30A and treated with MG132 for 2 h before lysis.
- Immunoblot analysis of endogenous TSC2 in TSC1‐KO MEFs transfected (for 48 h) with Myc‐TSC1 wild‐type or K30A and subsequently treated with cycloheximide (10 μg/ml) for the indicated time periods before lysis. The right panel is a summary graph of quantified TSC2 WT and K30A protein bands presented as percentages of the level in the untreated (0 min) lane.
Data information: Summary graphs in B, D, and F are densitometric quantification of the indicated protein bands based on three independent experiments, and bar graphs are presented as mean ± SEM. P values are determined by a two‐tailed unpaired Student’s t‐test. *P < 0.05.
Source data are available online for this figure.
