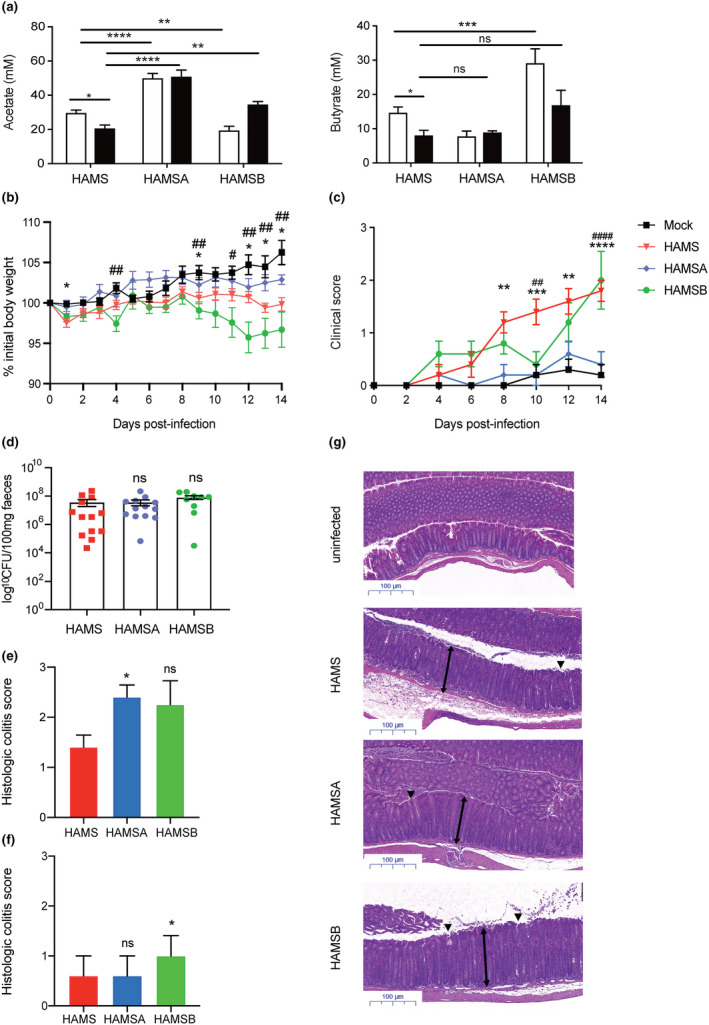
Figure 1.

Restored concentrations of SCFA acetate by HAMSA diet is associated with reduced susceptibility to C. rodentium infection. (a) Acetate and butyrate concentrations in the faeces of C57Bl/6J mice fed high amylose starch (HAMS), acetylated HAMS (HAMSA) or butyrylated HAMS (HAMSB) supplement ad libitum from pre‐infection (3 weeks, white bars) and post‐infection (2 weeks, black bars) with C. rodentium. Pre‐infection faecal SCFA concentrations determined at day 0 of C. rodentium infection model, and 14 DPI (n = 5 per group). (b) Body weight changes and (c) stool scores in faeces (0 = normal stool; 1 = soft stool; 2 = diarrhoea; 3 = diarrhoea and anal bleeding) from C57Bl/6J mice fed HAMS, HAMSA or HAMSB diets at 14 DPI (n = 9 or 13). (d) Bacterial load of C. rodentium in faeces from mice at day 14 DPI. Histological colitis scores showing (e) inflammatory infiltrate and (f) epithelial damage of the distal colon as mean ± SEM (n > 4). The scoring system is described in the Methods. Uninfected mice (not represented) scored 0 in all categories (n = 4 or 5 mice per group). (g) Representative H&E slides from distal colon sections at 14 DPI. Single‐headed arrows indicate the degree of immune cell infiltration within the base of the mucosa, which appears to be greater in infected mice than uninfected mice. Double‐headed arrows indicate mucosal thickness, ▼ highlights noticeable tattering and erosion on the epithelial surface. Scale bar = 100 µm, (n = 5). Data are expressed as mean ± S.E.M. P‐values determined by one‐way ANOVA (a, d, e, f) or two‐way ANOVA (b, c) with Bonferroni’s correction. (b) *uninfected vs HAMS; #uninfected vs HAMSB. (c) *HAMSA vs HAMS (day 8, 12); #HAMSB vs HAMS. Graphs and disease incidence are representative of 2 independent experiments. ns = not significant. * or # P < 0.05, ** or ## P < 0.01, *** or ### P < 0.001, **** or #### P < 0.0001.
