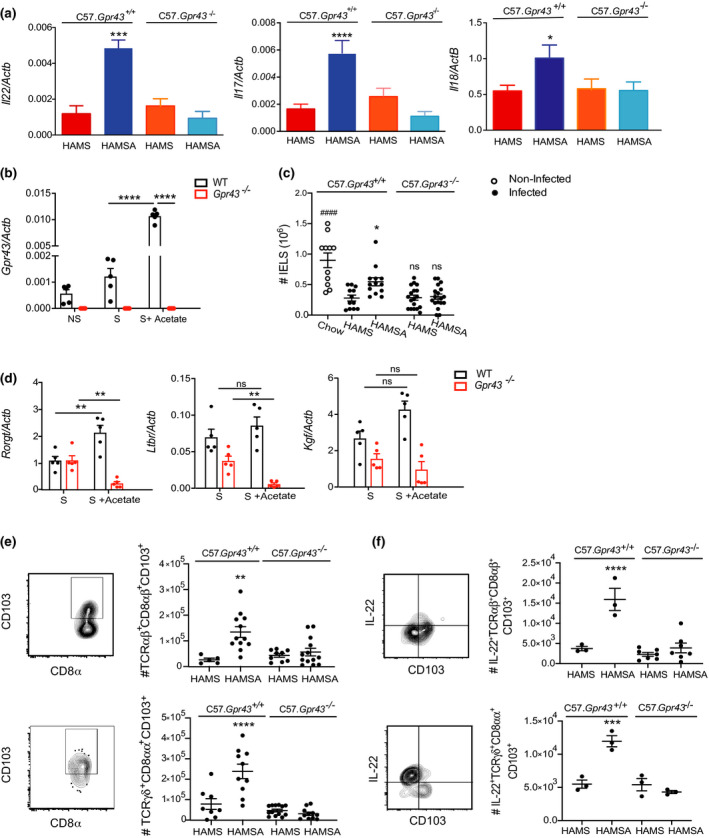
Figure 6.

HAMSA diet enhances IL‐22, IL‐17 and number of IELs via GPR43. (a) Expression of Il‐22, Il‐17 and Il‐18 in the colon tissue of infected mice 14 DPI determined by qPCR.(b)Expression of Gpr43 in isolated colonic IELs from C57Bl/6J mice stimulated with PMA and with or without sodium acetate by qPCR. (c)Number of total colonic IELS from infected and non‐infected C57.Gpr43 +/+ or C57.Gpr43−/− mice fed HAMS and HAMSA diets analysed by flow cytometry. (d) Expression of Rorγt, Ltbr and Kgf in isolated colonic IELS from C57Bl/6J mice stimulated with PMA and with or without sodium acetate by qPCR (n = 5). (e) Number and FACS plots of TCRαβ+CD8αβ+CD103+ and TCRγδ+CD8αα+CD103+ IELs from C57.Gpr43 +/+ or C57.Gpr43−/− mice fed HAMS or HAMSA diet. (f) Number of IL‐22+TCRαβ+CD8αβ+CD103+ and IL‐22+TCRγδ+CD8αα+CD103+ IELs from C57.Gpr43 +/+ or C57.Gpr43−/− mice fed HAMS or HAMSA diet. All cellular proportions determined by flow cytometry at 14 DPI. Data are expressed as mean ± S.E.M. P‐values were determined by one‐way ANOVA (a, c, e) or two‐way ANOVA (b, d) with Bonferroni’s correction. (e, f) *HAMSA‐fed vs HAMS‐fed C57.Gpr43 +/+. Each symbol in b–f represents data from an individual mouse. Graphs are representative of 2 or 3 independent experiments. ns = not significant. *P < 0.05, **P < 0.01, ***P < 0.001 **** or #### P < 0.0001.
