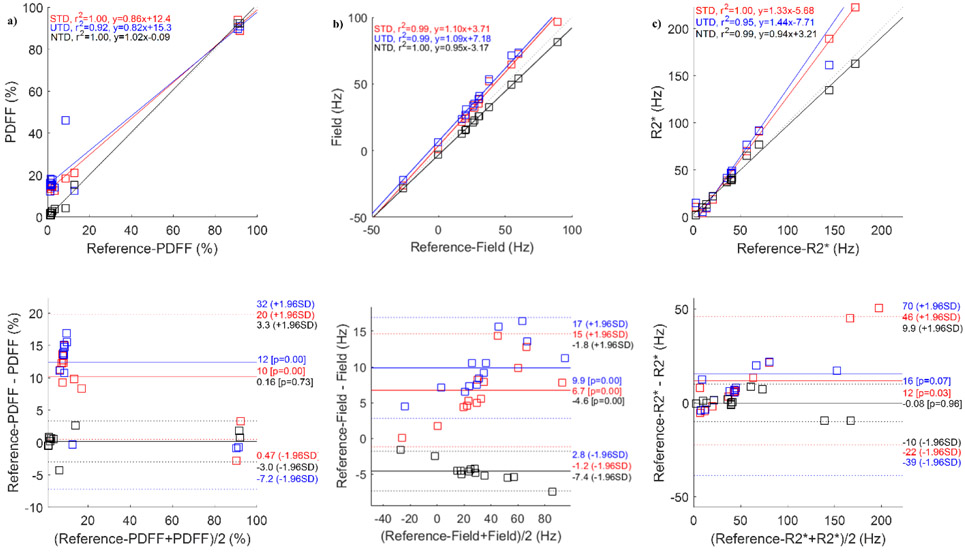
Figure 8.
ROI measurement correlation and Bland-Altman analysis comparing proton density fat fraction (a), field (b) and R2* (c) reference images with the corresponding results for supervised (STD), unsupervised (UTD), and no-training (NTD) methods in a healthy subject when training (GE, 1.5T) and testing (Siemens, 1.5T) scanner and acquisition parameters were different. Corresponding images are shown in Figure 7.

