
Figure 2.
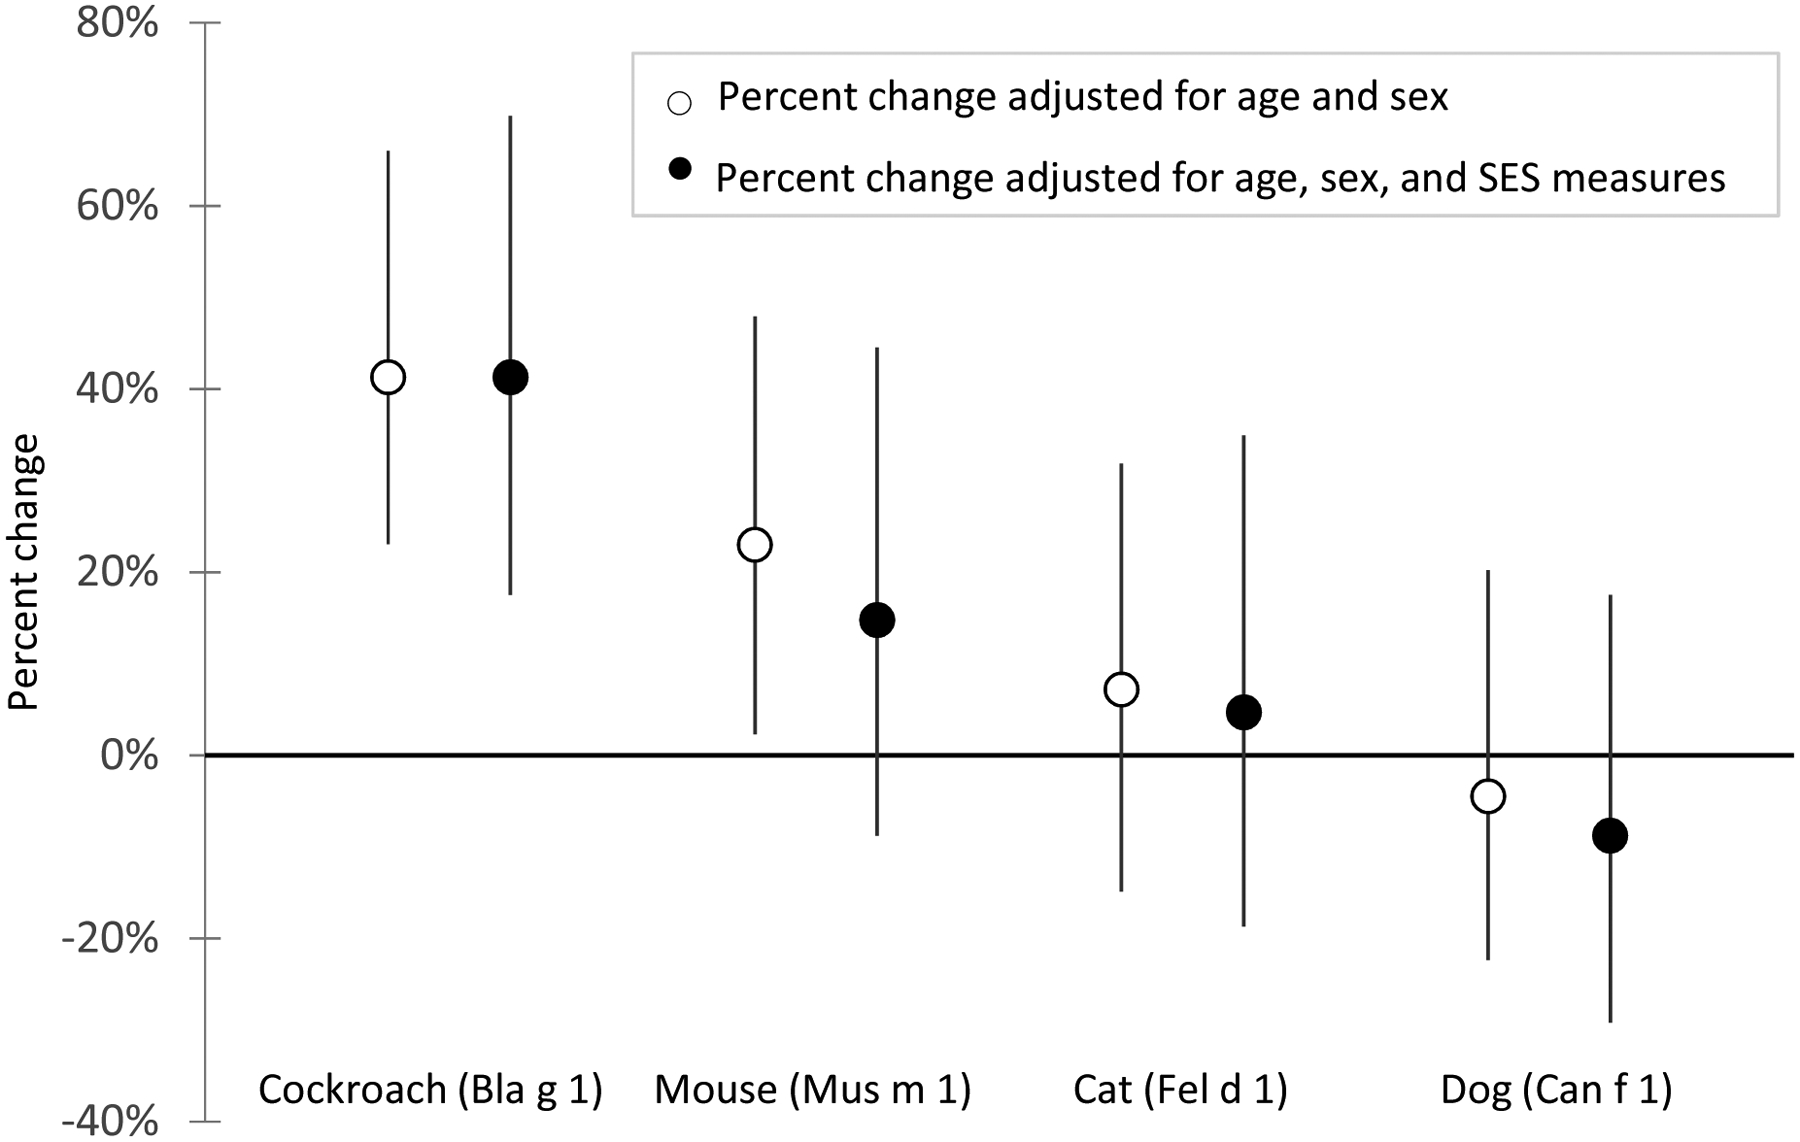
Estimated change in allergen levels per 1-point increase in total material hardship score. Circles represent the estimated percent change and whiskers represent the 95% confidence intervals.
Official websites use .gov
A
.gov website belongs to an official
government organization in the United States.
Secure .gov websites use HTTPS
A lock (
) or https:// means you've safely
connected to the .gov website. Share sensitive
information only on official, secure websites.
Estimated change in allergen levels per 1-point increase in total material hardship score. Circles represent the estimated percent change and whiskers represent the 95% confidence intervals.