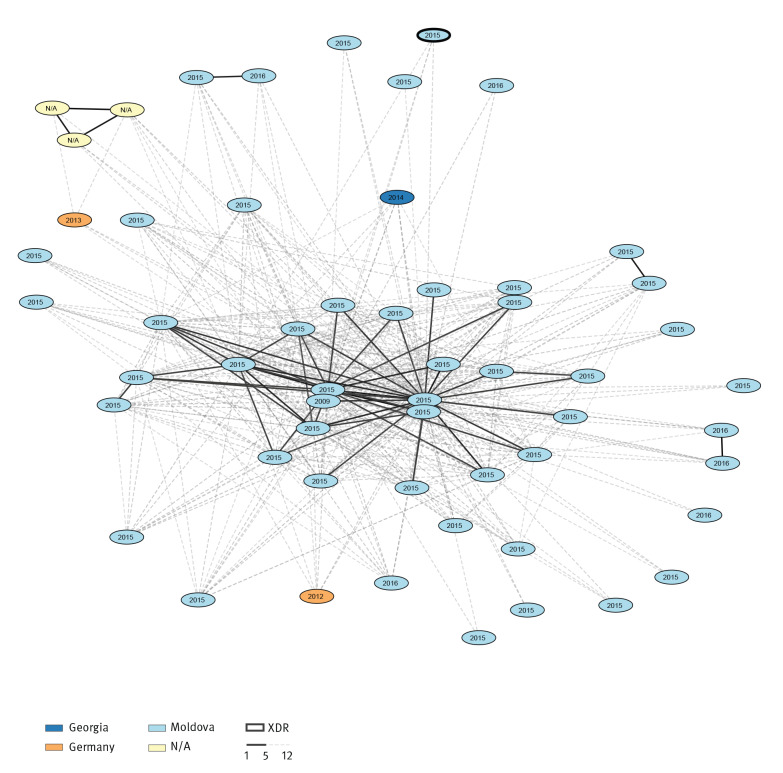
Figure 2.
Visualisation of the transmission Cluster 2 identified among the Mycobacterium tuberculosis isolates analysed in our study, 1996–2016 (n = 56)
The country of isolation, multi- and extensive drug-resistance classification and year of isolation are represented in the clusters. SNP distances were calculated for each pair of isolates individually. Links with fewer than 6 SNPs are marked black, those with fewer than 13 SNPs are marked in grey. Connections with 13 SNPs or more than are not shown in the network.

