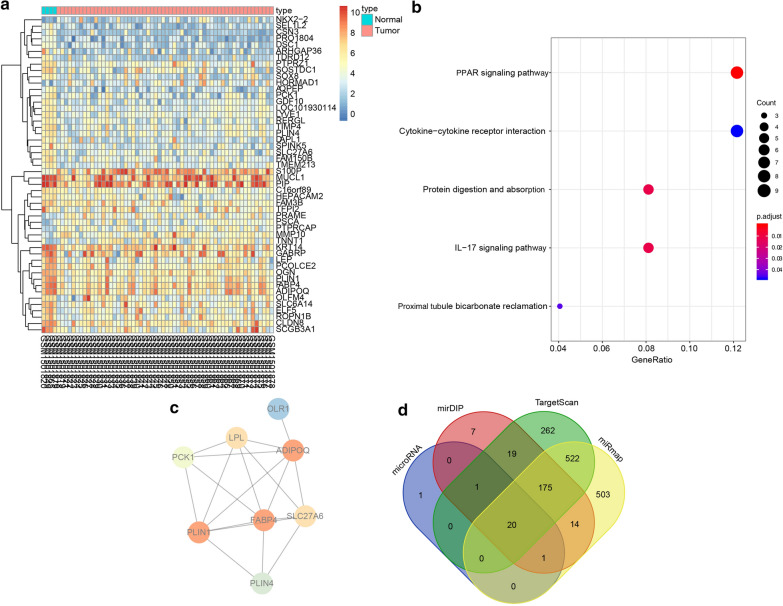
Fig. 3.
ADIPOQ and miR-9-5p is involved in the drug resistance of BC. a Heat map of BC-related DEGs in different expression profiles. The x-axis indicates the sample number, the y-axis indicates the gene name, and the left dendrogram indicates the gene expression cluster. Each small square in the panel indicates the expression of a gene in one sample. b Enrichment analysis of DEGs in KEGG metabolic pathways. The x-axis refers to GeneRatio, the y-axis refers to KEGG signaling pathways, and the right histogram represents color gradation. c Protein–protein interaction network of the DEG in the PPAR signaling pathway. Each circle represents a gene and the circle color represents the core degree of the DEG in the interaction network. Darker color means higher core degree. d Prediction of upstream regulatory miRNAs of ADIPOQ. Four ellipses refer to the results predicted from the four databases and the central section refers to the intersecting of the prediction results

