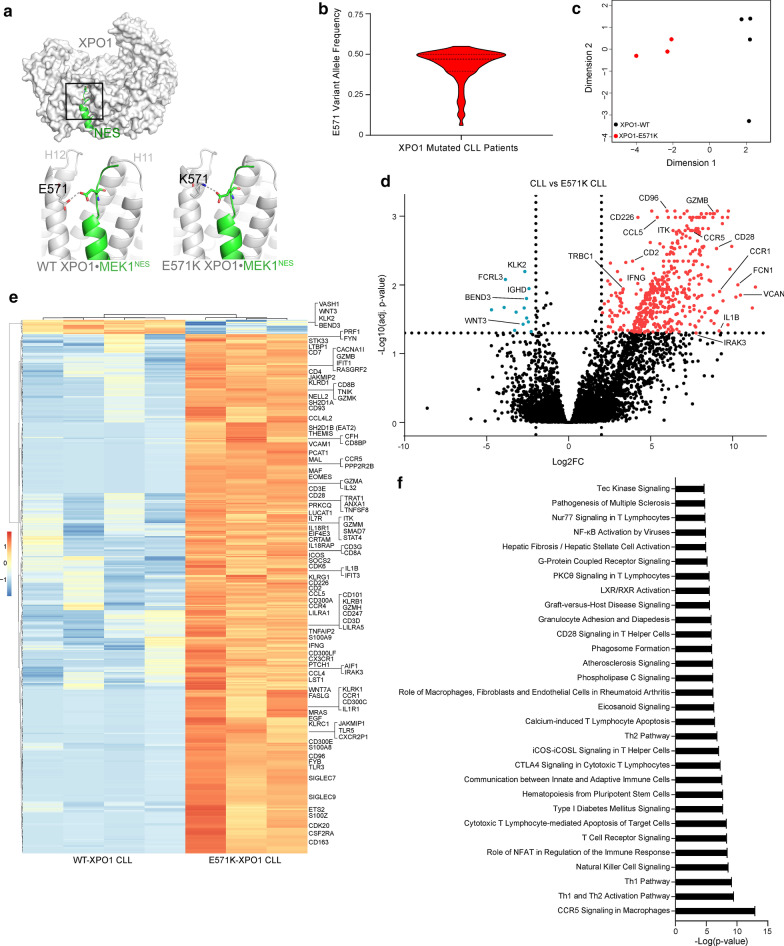
Fig. 1.
E571 XPO1 mutations occur in CLL and disrupt the transcriptome of the CLL cell. Structure of wildtype XPO1 (grey surface; RanGTP and RanBP1 in the complex are not shown for clarity) with an NES peptide (green cartoon) bound in NES-binding groove, which is located on the convex side of the protein between HEAT repeats H11 and H12. Details of the boxed area is shown in the bottom left panel: the NES peptide, Mek1NES, binds close to (3.4 Å) the side chain of E571 of wildtype XPO1. Bottom right: the E571K mutation places a lysine at position 571, which makes electrostatic interactions with a glutamate side chain of Mek1NES causing the NES to bind much tighter to the XPO1 mutant [50]. Due to its simplicity, interactions with the E571G mutation are not shown. a Violin plot depicting the variant allele frequency (VAF) in CLL patients with an E571 XPO1 mutation. A median VAF of 0.47 (25th percentile = 0.39, 75th percentile = 0.50) suggests the heterozygous E571 XPO1 mutation is present in the dominant clone in these patients. Fewer than 5 XPO1-mutated CLL cases presented a VAF < 0.20. b Multidimensional scaling (MDS) plot of the top 1000 most variable genes in CLL cells isolated from patients with (E571K; n = 3) and without (WT; n = 4) an E571K XPO1 mutation demonstrate distinct clustering between mutated and non-mutated CLL samples along MDS dimension 1. c Volcano plot depicting adjusted p-values (FDR) versus log twofold change between E571K XPO1 and WT XPO1 IGHV-U CLL samples. Differentially expressed genes were selected with a fold change cutoff of 4 at 5% FDR. Significant genes enriched in E571K-mutated CLL cell samples are shown in red, and significant enrichment of genes in wt-XPO1 CLL cell samples are shown in blue. Along with upregulation of known supportive oncogenes, E571K XPO1 mutated CLL samples appear to demonstrate an increase in T cell-specific genes. d Heat map demonstrating differential expression of genes (|FC|> 4, FDR < 0.05) between E571K XPO1 (n = 3) and WT XPO1 (n = 4) IGHV-U CLL samples. Genes of interest are labeled. e Ingenuity Pathway Analysis (IPA) software analysis using significant differentially expressed genes in E571K XPO1 mutated CLL samples reveals perturbed downstream pathways enriched in T cell-related signaling and proliferation pathways. Enriched pathways are sorted by –Log(p value)

