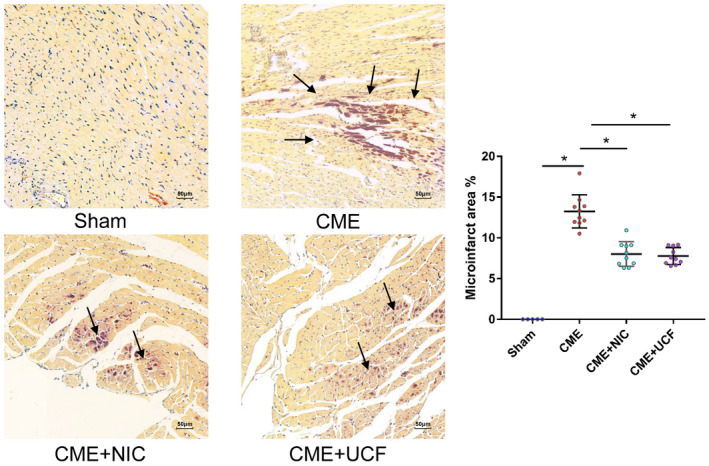
FIGURE 3.

Hematoxylin basic fuchsin picric acid staining of myocardium shows microinfarct after modeling. (magnification 200×; bar = 50 μm) (Sham = 5, CME = 10, CME + NIC = 10, CME + UCF = 10). Normal myocardium is stained yellow, whereas ischemic or infarcted myocardium is stained dark red. Arrow points to the microinfarct area. There was no clear red infarct area in the Sham group. The microinfarct area in the CME + NIC and CME + UCF groups was significantly reduced. *P < .05
