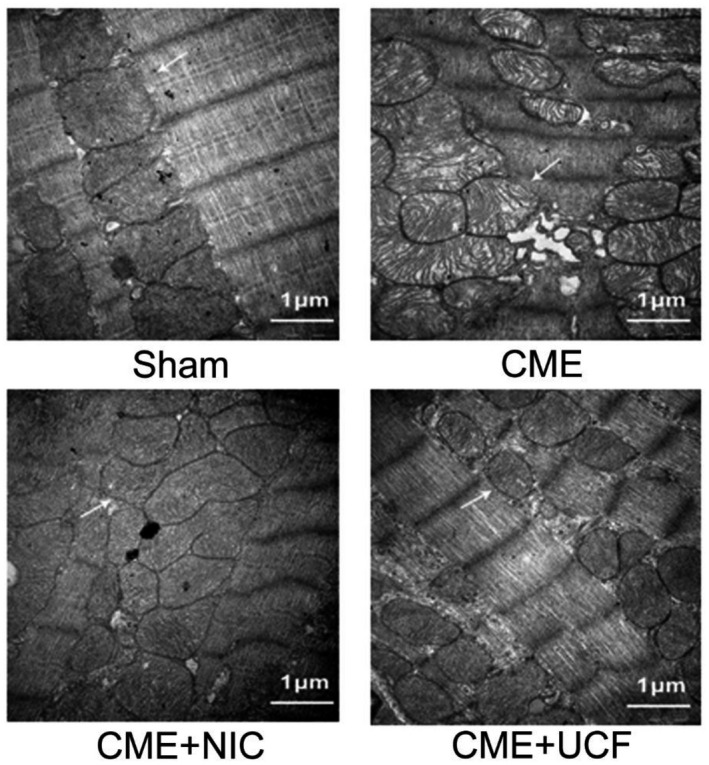
FIGURE 4.

Transmission electron micrograph of rat myocardium (magnification: 30 000×, scale bar = 1 μm). The arrows indicate mitochondria. The mitochondrial membrane in the Sham group was essentially intact. The mitochondria in the coronary microembolization (CME) group were significantly swollen, and the ridges were broken. The mitochondria in the CME + NIC group were slightly swollen, and the structure was appeared intact. The changes in CME + NIC were similar to CME + UCF (n = 5 in all groups)
