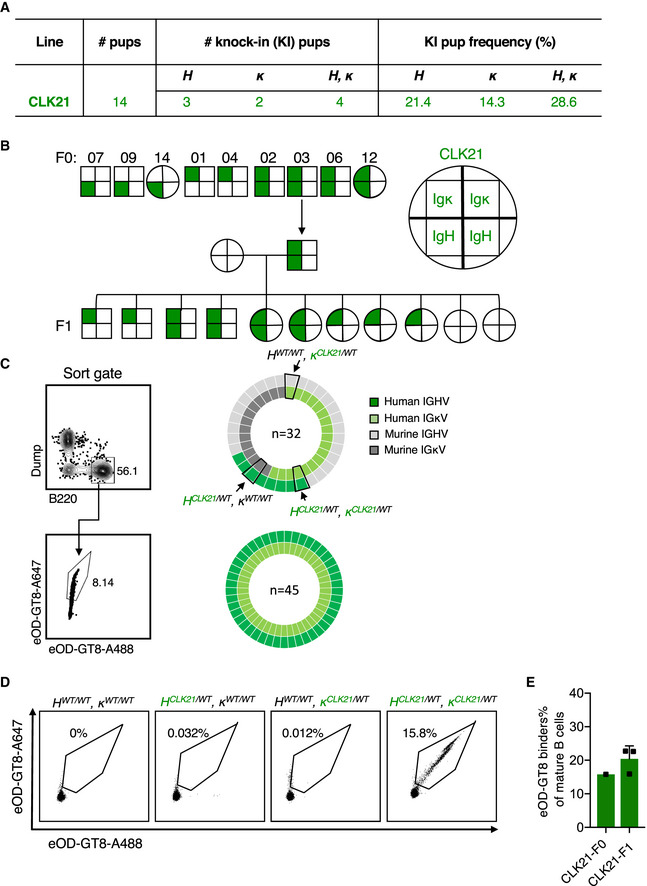
Table shows the total number of pups, the number or frequency of human HC‐, human LC‐, and human BCR KI pups after One‐step CRISPR/Cas9 microinjection of CLK21.
CLK21 KI mice F0 and F1 generations. Squares represent male mice and circles represent female mice. Upper halves of squares or circles represent Ig κ, and the lower halves represent Ig H, as shown in the schematic. F0 generation mice genotyping results showing 7, 9 and 14 are HCLK21/WTκWT/WT, 1 and 4 are HWT/WTκCLK21/WT, and 2, 3, 6, and 12 are HCLK21/WTκCLK21/WT. Mouse 3 was crossed with WT to obtain 11 F1 progeny: Five F1 mice are HWT/WT κCLK21/WT, four are HCLK21/WTκCLK21/WT and two are WT.
Single‐cell sequencing for naïve B cells from heterozygous CLK21 double KI mice. Left column shows the gating strategy for sorting naïve B cells (upper) and eOD‐GT8‐specific naïve B cells (lower). Right pie charts show the frequency of paired HC and LC sequences among total naïve B cells (upper) and eOD‐GT8‐specific naïve B cells (lower).
Germline‐targeting eOD‐GT8 binding activity of B cells from WT, HCLK21/WTκWT/WT, HWT/WT κCLK21/WT), and HCLK21/WT, κCLK21/WT KI mice. 8‐week‐old mice were detected by FACS. X and Y axes represent that BCR were stained with eOD‐GT8 tetramer conjugated with Alexa Fluor™ 488 and Alexa Fluor™ 647, respectively. Representative dots were gated from Scatter/Singlet/Live (SSL), B220+ IgM+ IgD+.
Quantification of eOD‐GT8 binding in CLK21 KI mice. X‐axis represents F0 (n = 1) and F1 (n = 3) KI animals, and the Y‐axis represents the percentage of eOD‐GT8 targeting binders in mature (IgM+ IgD+) B cells. Bars indicate mean ± SD from mice in each group.

