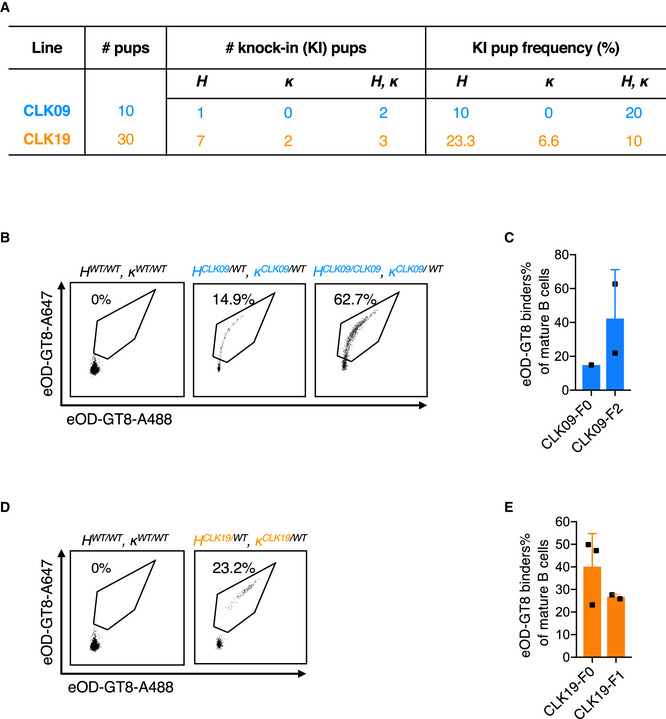
Figure 3. Generation of CLK09 and CLK19 human BCR knock‐in mouse model.

- Table shows the total number of pups, the number or frequency of human HC‐, human LC‐and human BCR KI pups after One‐step CRISPR/Cas9 microinjection of CLK09 and CLK19.
- Binding activity detection of heterozygous CLK09 human BCR KI mice to eOD‐GT8.8‐week‐old mice were detected by FACS. X‐axis and Y‐axis represent that BCR were stained with eOD‐GT8 tetramer conjugated with Alexa Fluor™ 488 and Alexa Fluor™ 647, respectively. Representative dots were gated as in Fig 2D.
- Quantification of eOD‐GT8 targeting CLK09 KI mice. X‐axis represents F0 (n = 1) and F2 (n = 2) pups, Y‐axis represents as in Fig 2E. Bars indicate mean ± SD from mice in each group.
- Binding activity detection of heterozygous and homozygous CLK19 human BCR KI mice to eOD‐GT8. 8‐week‐old mice were detected by FACS. X and Y axes represent as in (B).
- Quantification of eOD‐GT8 binding in HCLK19/WT κCLK19/WT KI mice. X‐axis represents F0 (n = 3) and F1 (n = 2) animals, Y‐axis represents as in Fig 2E. Bars indicate mean ± SD from mice in each group.
