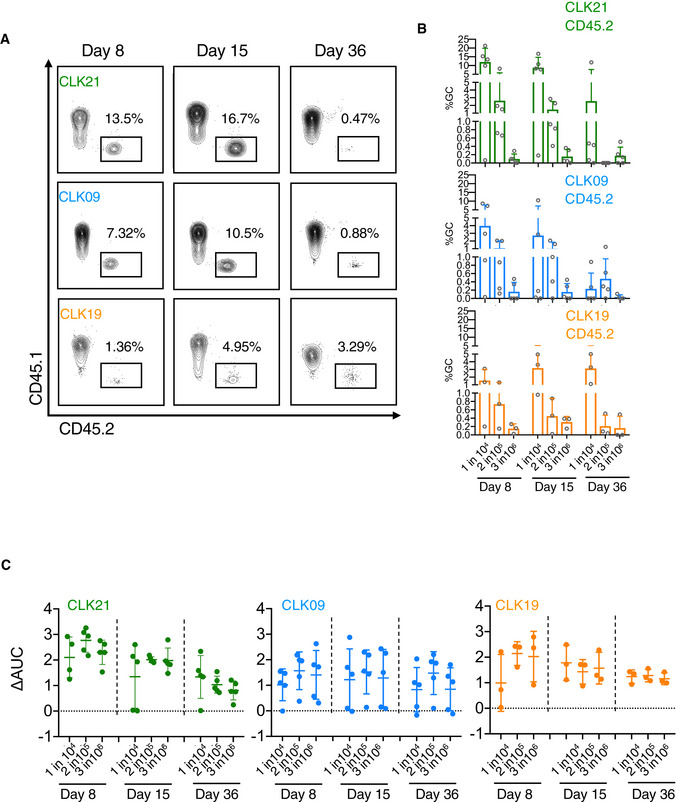
Figure 6. Duration of GC response in CD45.2 adoptively transferred mice.

- CD45.2 frequency among GCs induced by eOD‐GT8 60mer at different time points. Adoptively transferred mice with 1 in 104 of precursor frequency were immunized with eOD‐GT8 60mer. On days 8, 15 and 36, the splenic B cells were isolated to measure the CD45.2 cell frequency in GC B cells by FACS using the markers as in Fig 5B mentioned above by FACS. Gated plots represent the CD45.2 frequency among GC B cells.
- Quantification of CD45.2 frequency among GCs at three time points. X‐axis represents adoptively transferred mice groups with different precursor frequencies (1 in 104, 2 in 105, 3 in 106) at three time points, Y‐axis represents CD45.2 frequency among GC. Each circle represents one mouse. For CLK21 and CLK09 panel, n = 5 mice in each group. For CLK19 panel, n = 3 mice in each group. Bars indicate mean ± SD from mice in each group.
- IgG titers detected by ELISA. eOD‐GT8 or eOD‐GT8 KO soluble proteins were used to coat ELISA plates. Sera from adoptively transferred mice at different time points were used to detect by ELISA. Bars indicate geometric mean and geometric SD from mice in each group. For CLK21 and CLK09 panel, n = 5 mice in each group. For CLK19 panel, n = 3 mice in each group. X‐axis represents precursor frequency, and Y‐axis represents the change of area under curve (AUCcoated eOD‐GT8 − AUCcoated eOD‐GT8 KO). Each circle represents one mouse.
